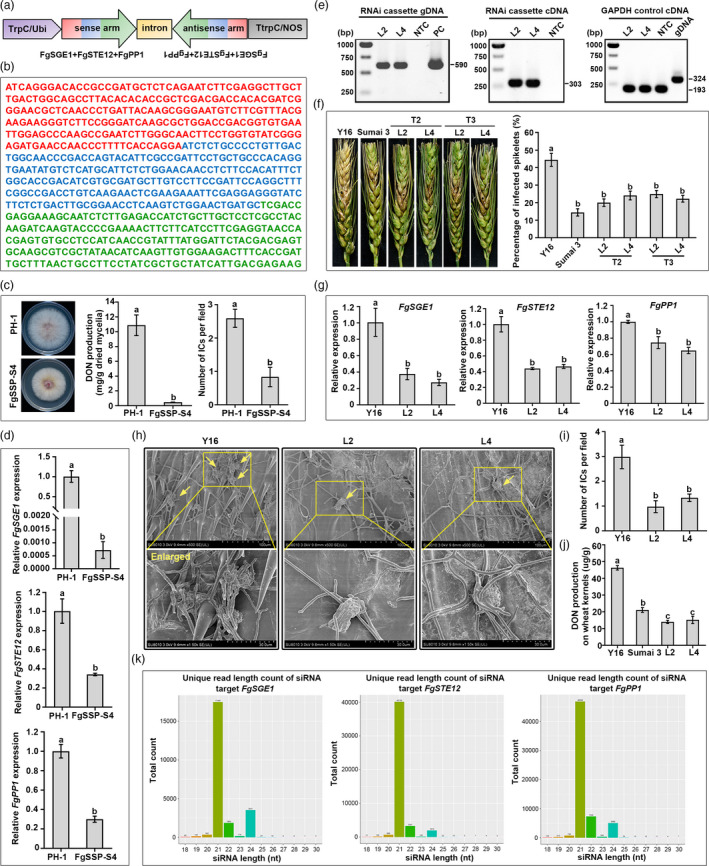
Figure 1.

HIGS of chimeric FgSGE1‐STE12‐PP1 results in strong resistance to Fusarium head blight. (a) Schematic map of the FgSGE1‐STE12‐PP1 RNAi cassettes. TrpC, fungus promoter; TtrpC, fungus terminator; Ubi, plant promoter; NOS, plant terminator. (b) Sequence representation of FgSGE1‐STE12‐PP1 RNAi fragments. FgSGE1, FgSTE12 and FgPP1 are indicated in red, blue and green, respectively. (c) Silencing transformant FgSSP‐S4 reduces mycelial growth, DON production in DON inducing medium (TBI) at 7 days post‐inoculation (dpi) and infection cushions (ICs) on wheat lemma at 3 dpi. (d) Relative expression levels of FgSGE1, FgSTE12 and FgPP1 are decreased in FgSSP‐S4. The ACTIN gene was used as the reference. (e) Genomic PCR and RT‐PCR analyses of T3 transgenic wheat lines L2 and L4. The wheat GAPDH gene is amplified using the primers across an intron to distinguish genomic DNA and cDNA. (f) FHB resistance in T2 and T3 transgenic wheat lines. Representative images of infected wheat heads are photographed at 21 dpi, and percentage of infected spikelets are calculated. Data presented are the mean ± SE (n ≥ 20). (g) Relative mRNA expression of three target genes of F. graminearum during infection of transgenic lines and Yangmai 16 (Y16) at 3 dpi. (h) ICs (as yellow arrows indicate) of F. graminearum on wheat lemma from two T3 transgenic lines and Y16 at 3 dpi by scanning electron microscopy (SEM) observation. (i) The average number of ICs in a SEM examination field. (j) DON content of wheat kernels from T3 transgenic wheat lines and Y16 at 35 dpi. (k) Length distribution and abundance of siRNAs targeting FgSGE1, FgSTE12 and FgPP1, respectively, in T3 transgenic wheat line L2. Data presented are the mean ± SD (n = 3). Different letters indicate a significant difference (P < 0.05) according to Student’s t‐test
