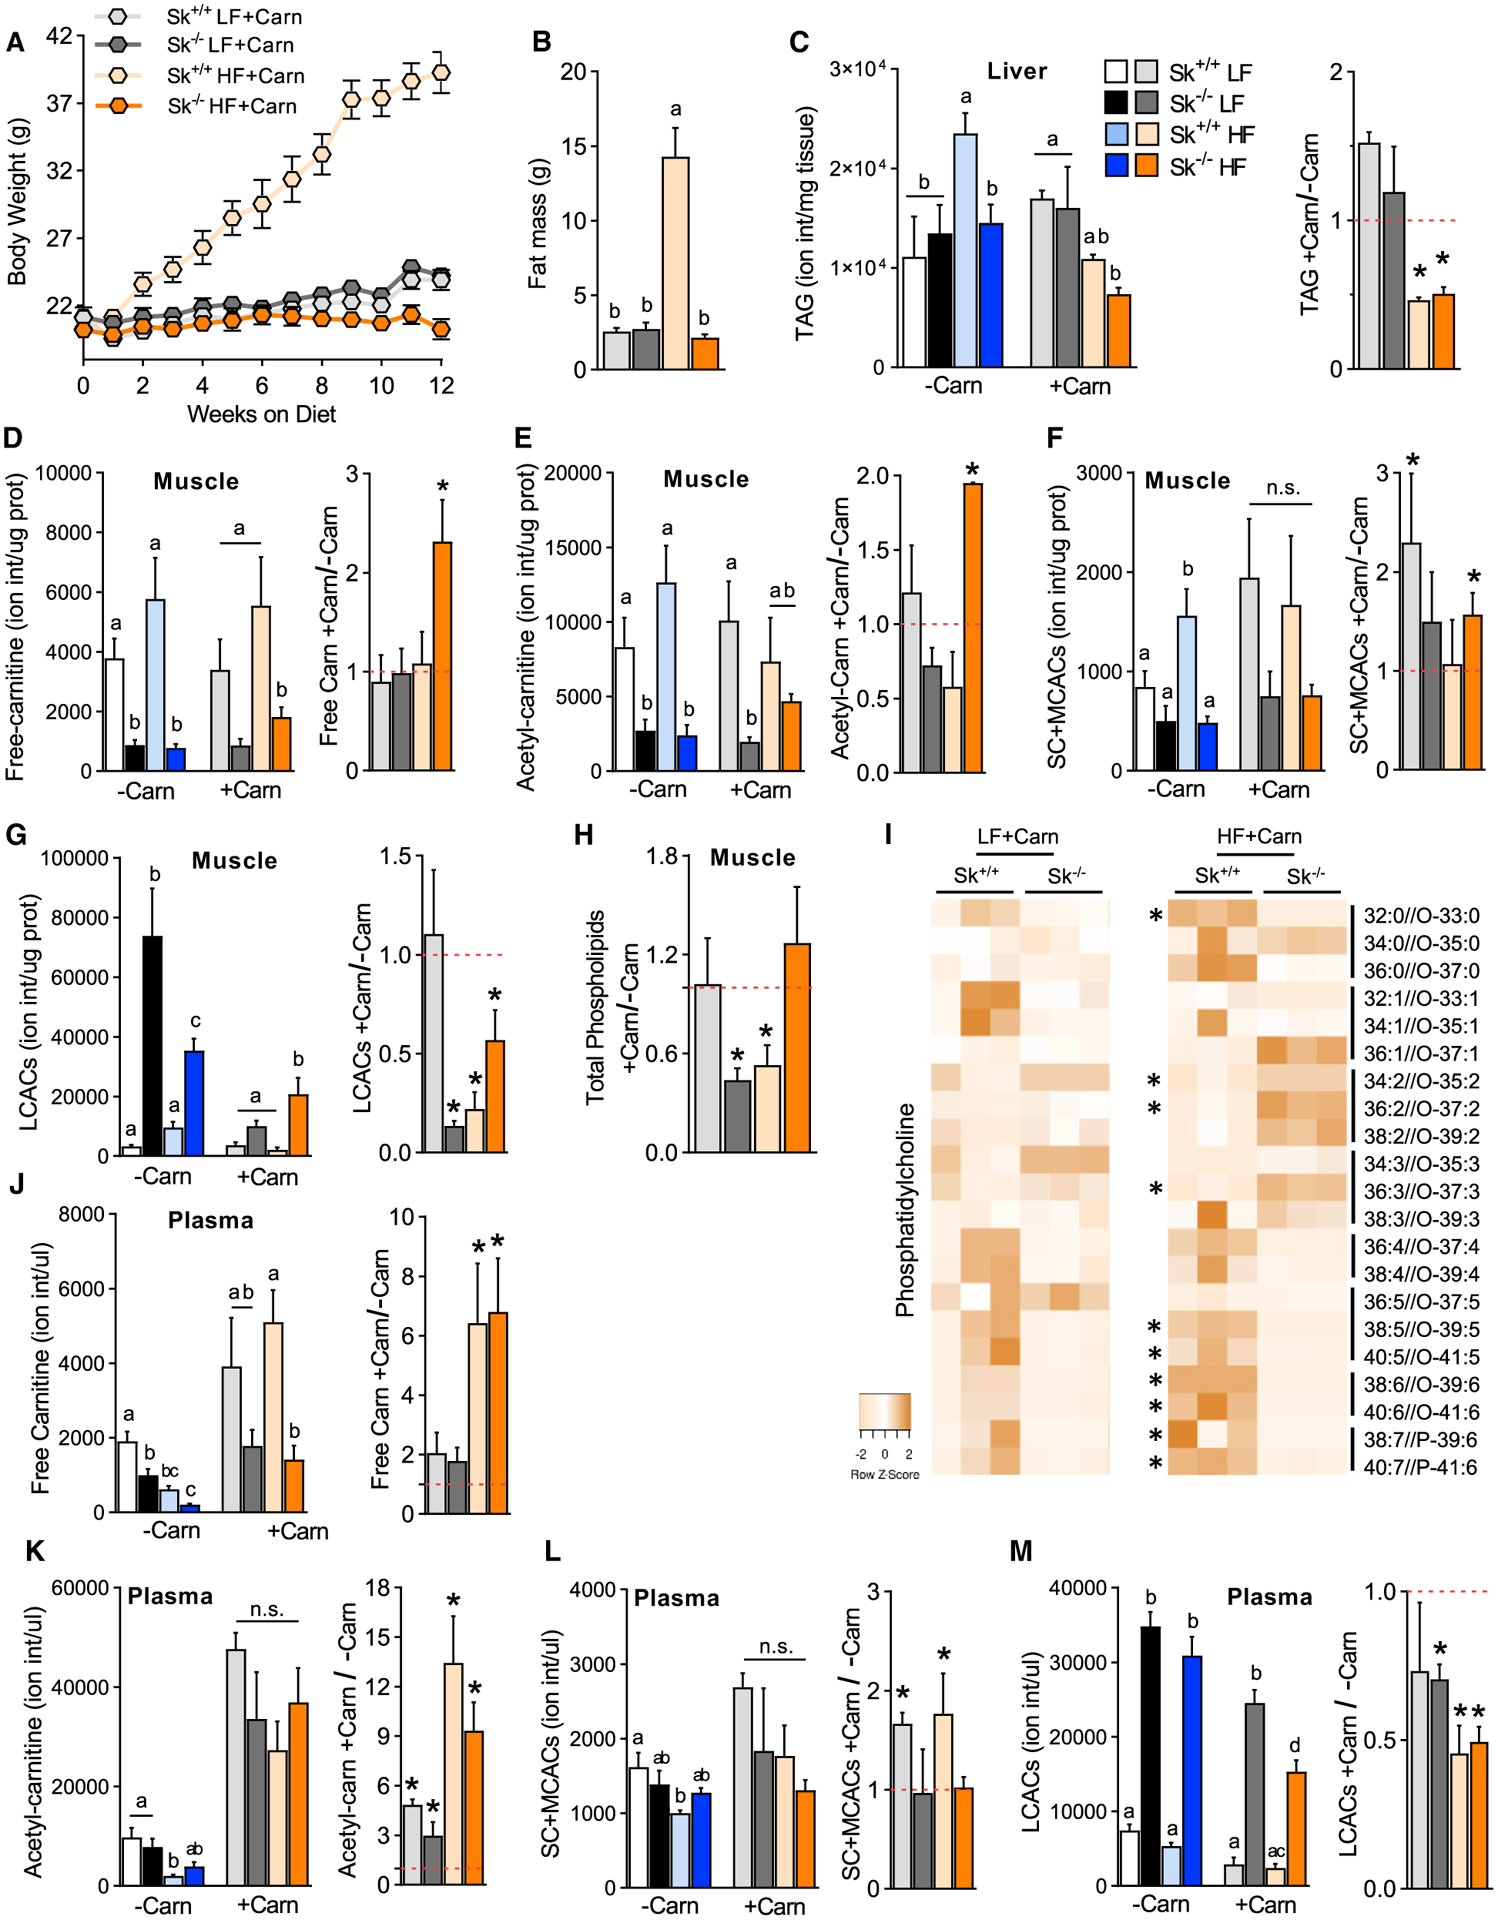
Figure 6. Carnitine Supplementation Lowers LCACs Independent of Fatty Acid Oxidative Metabolism.

(A) Body weight of Cpt2Sk+/+ and Cpt2Sk−/− female mice fed a LF or HF diet supplemented with (+Carn) or without (−Carn) L-carnitine for 16 weeks (n = 6–9).
(B) Whole-body fat mass of female mice fed a LF or HF diet with L-carnitine supplementation (n = 6–9).
(C) Ion intensity per milligram of liver for TAGs of female mice fed a LF or HF diet with and without L-carnitine (n = 6 for −Carn and n = 3–4 for +Carn).
(D–G) Ion intensity per microgram of protein for free carnitine, acetyl-carnitine, short- and medium-chain ACs, and LCACs in skeletal muscle of female mice fed a LF or HF diet with and without L-carnitine (n = 6 for −Carn and n = 3–4 for +Carn).
(H) Fold change (+Carn/−Carn) for the sum of total phospholipids in TA muscle after L-carnitine supplementation of female mice (n = 6 for −Carn and n = 3–4 for +Carn).
(I) Heatmap for normalized abundance of PC species arranged by unsaturation degree of female mice fed a LF or HF diet with L-carnitine (n = 3).
(J–M) Ion intensity per microliter of plasma for free carnitine, acetyl-carnitine, short- and medium-chain ACs, and LCACs of female mice fed a LF or HF diet with and without L-carnitine (n = 6 for −Carn and n = 3–4 for +Carn).
Data are presented as mean ± SEM. *p < 0.05 determined by Student’s t test. Statistical analysis by 2-way ANOVA. Means depicting a different letter indicate significant differences between groups (p < 0.05). See also Figures S4 and S5.
