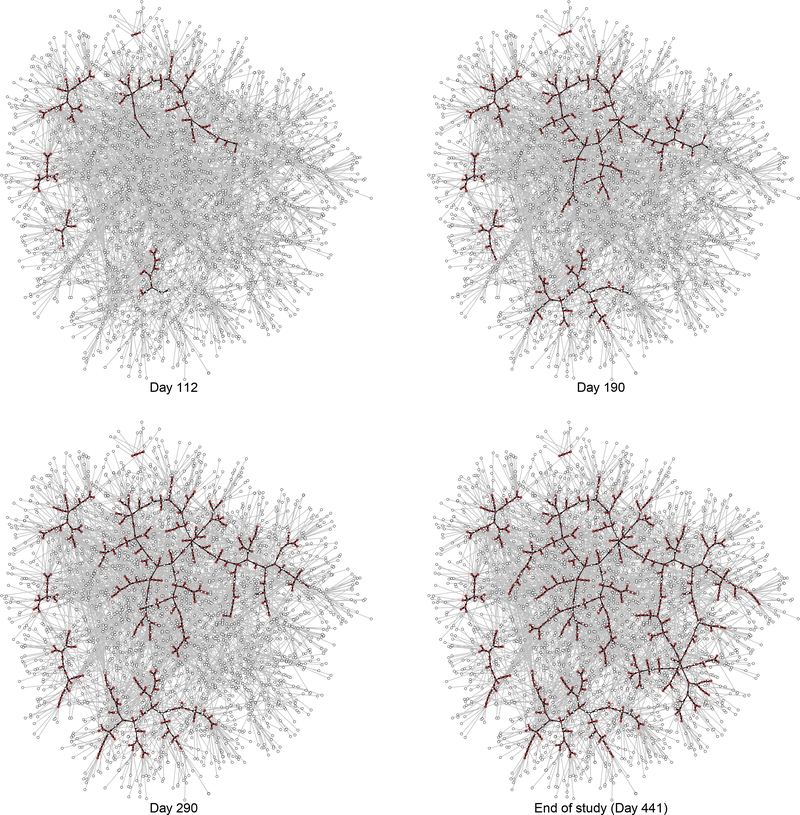
Figure 1.
Pattern of RDS recruitment among people who inject drugs in Hartford, CT from the RDS-net study. The nomination network is shown overlaid with the recruitment networks at four time points (112, 190, 290, 441 days after the beginning of study). Recruited subjects are shown in red, and recruitment edges are shown as a directed edge from the recruiter to the recruitee. Edges not associated with recruitments are shown in gray. The analysis presented in this paper aims to estimate recruiter and recruitee factors associated with recruitment in this network.

