Fig. 1.

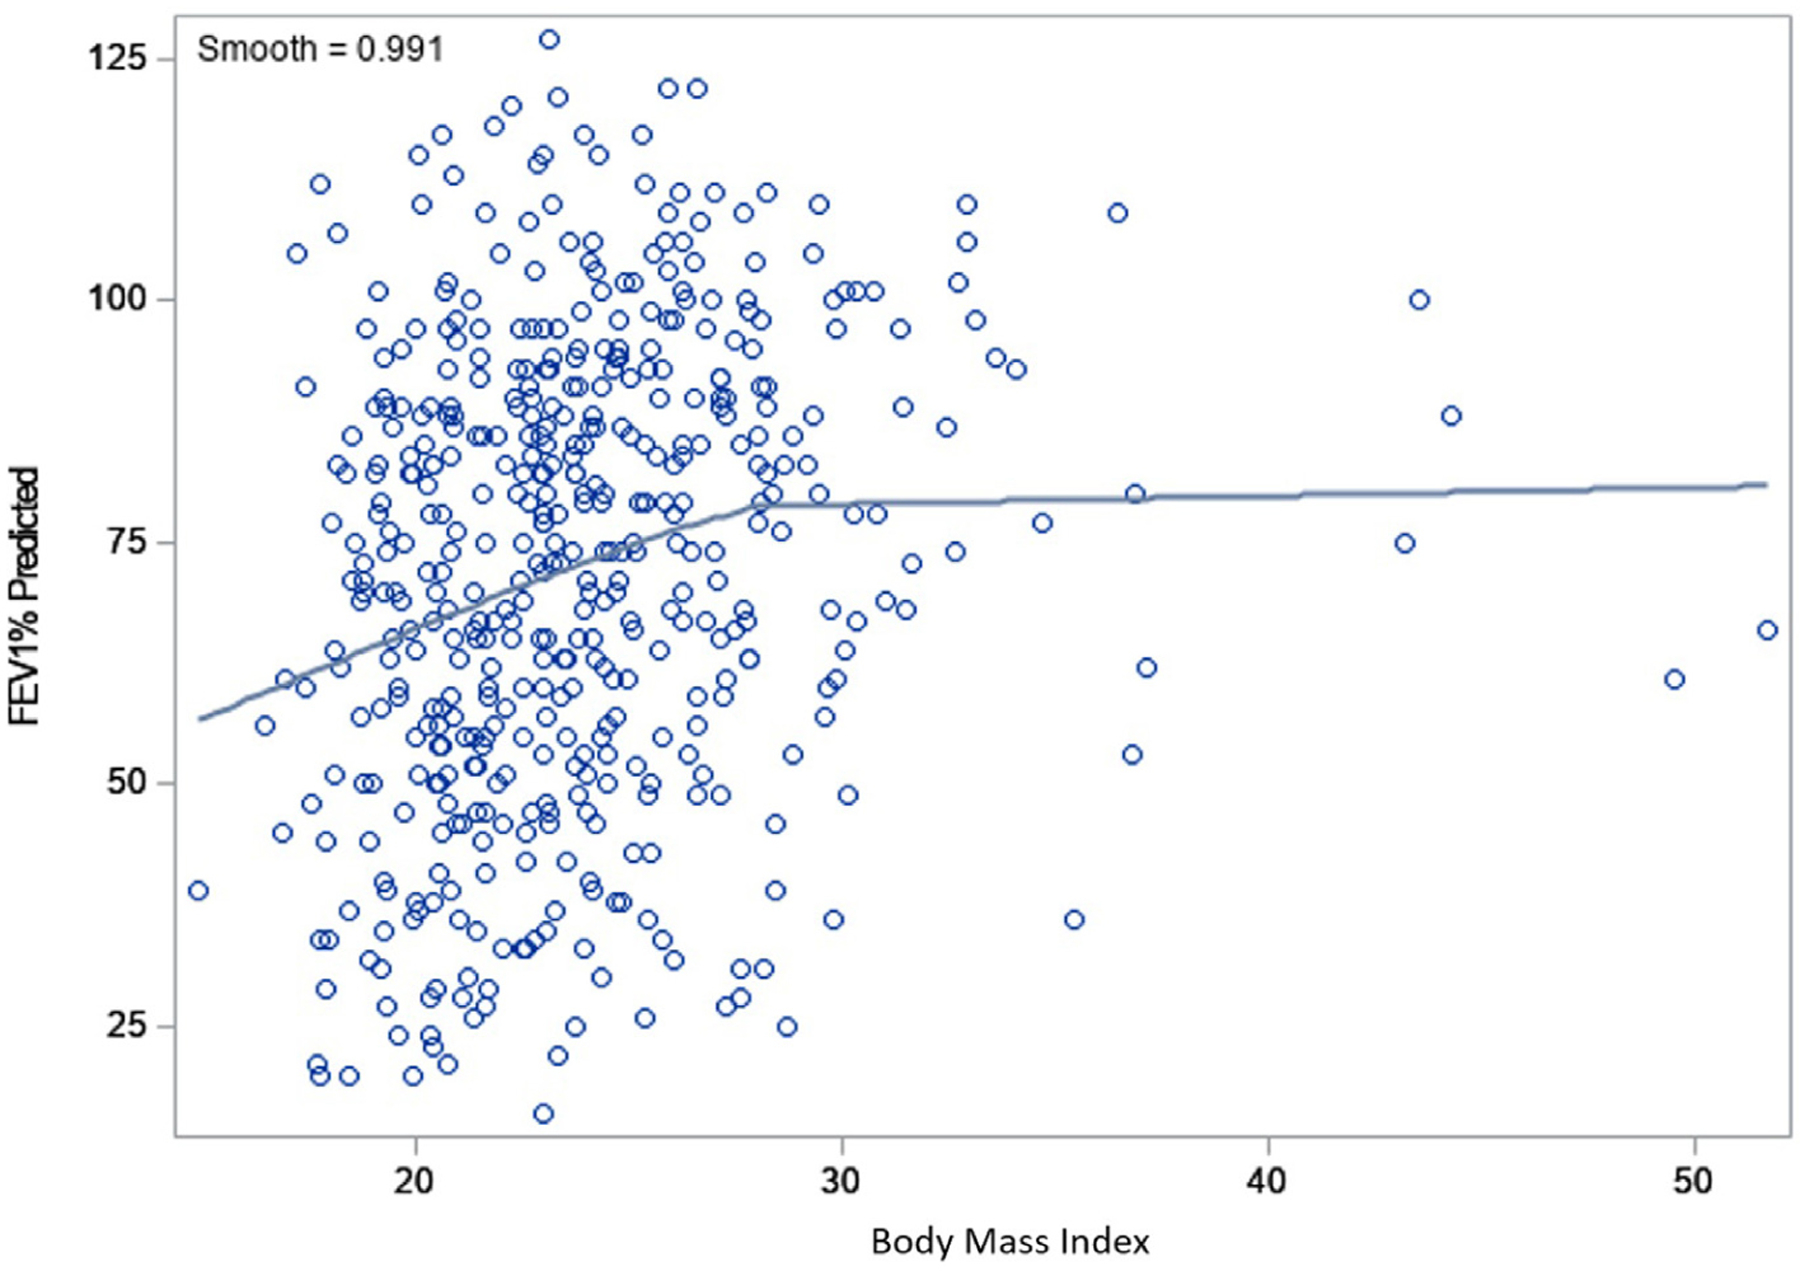
Loess fit curve between body mass index (BMI) and FEV1% predicted in all study cohort. BMI; Body mass index, FEV1% predicted; forced expiratory volume in 1 s expressed as a percentage of the normal predicted values for height and sex.

Loess fit curve between body mass index (BMI) and FEV1% predicted in all study cohort. BMI; Body mass index, FEV1% predicted; forced expiratory volume in 1 s expressed as a percentage of the normal predicted values for height and sex.