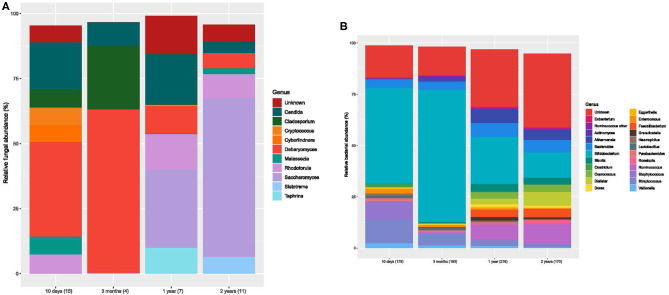
Figure 2.
Bar charts of fungal and bacterial gut communities. (A) Mean relative abundances for the fungal genera (>1% abundant) for each age group. Each color designates a genus. Number of samples for each bar is stated in brackets below the bar. (B) Mean relative abundances for the bacterial genera for each age group. Each color designates a genera. The number of samples is stated in brackets below the bar.

