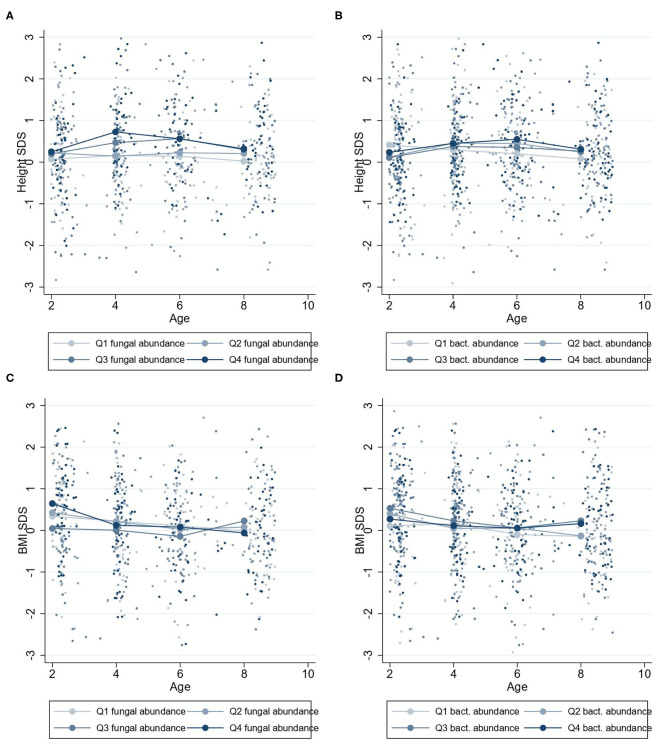
Figure 5.
Mean height-SDS and BMI-SDS at 2–9 years according to microbiota abundances at 2 years. Mean standard curve deviation (SDS) values for children at 2–9 years with four quartiles of microbiota abundances at 2 years. Group mean height-SDS at 2–9 years for four quartiles of abundances of fungi (A) and bacteria (B). Group mean BMI-SDS at 2–9 years for high or low abundances of fungi (C) and bacteria (D).

