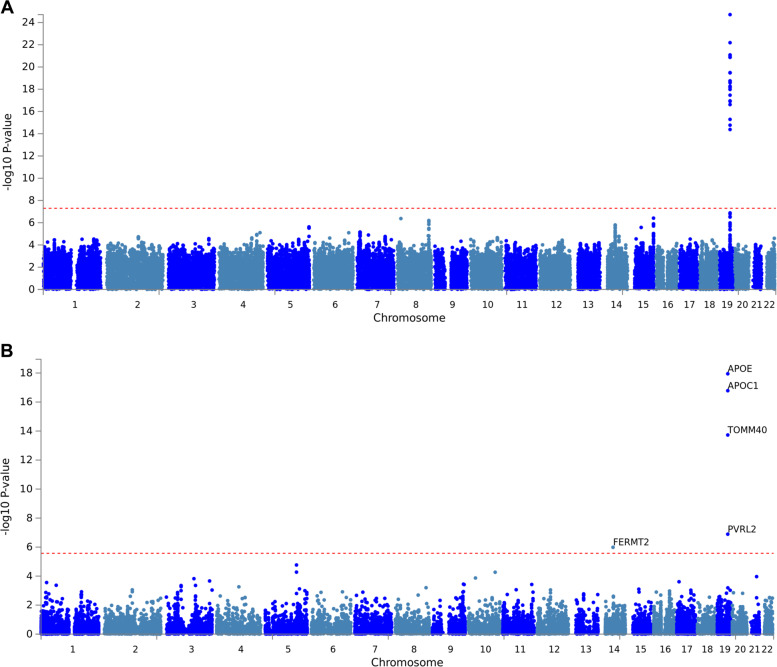
Fig. 1. GWAS results using amyloid status in the EMIF-AD MBD dataset.
Manhattan plots of A SNP level and B gene-level genome-wide association results with the “amyloid classification” variable across all diagnostic groups (n = 871). All plots include gene assignments made with FUMA. Dotted red lines represent the threshold for genome-wide significance, i.e., α = 5.0E-08 for SNP-based (A) and α = 2.671E-06 for gene-based (B) analyses.

