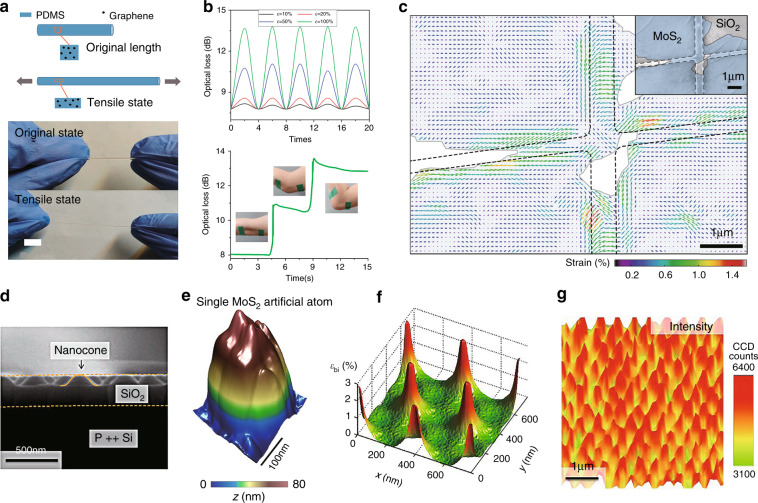
Fig. 10. Strain sensors, SHG-based strain mapping, and broad-spectrum solar energy funnel.
a Schematic of a PDMS fiber incorporating graphene nanocomposites (top panel) and photographs of the hybrid fiber in the original state and tensile state (bottom panel)133. b Strain-dependent optical loss of the fiber in a (top panel) and that measured with the movement of the human body (bottom panel)133. c Strain mapping in MoS2 by SHG spectroscopy. The inset shows an SEM micrograph of the sample81. (Scale bars in both images are 1 μm.) d Cross-sectional SEM micrograph of silica nanocones on a SiO2/Si substrate (Scale bar is 500 nm)134. e STM topography of a single MoS2 “artificial atom” consisting of monolayer MoS2 supported by a single silica nanocone (Scale bar is 100 nm)134. f Calculated local strain distribution in strain-textured MoS2 on the nanocone substrate, and g its PL peak intensity map134. The scale bar in g is 1 μm. Adapted a and b from ref. 133. Published by MDPI AG. Reprinted c with permission from ref. 81. Copyright (2018) Springer Nature. Adapted d–g with permission from ref. 134. Copyright (2015) Springer Nature

