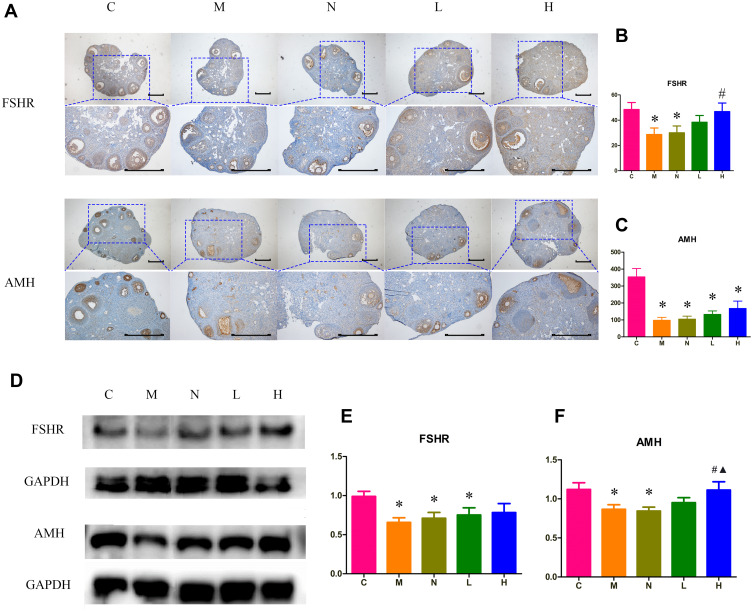
Figure 4.
Protein analysis of ovarian FSHR and AMH in different groups. (A) Immunohistochemistry analysis of ovary sections in different groups. (B) and (C) are quantitative analysis of the positive stained part in follicles. (D) Images of the Western-blot results in different groups. (E) and (F) are quantitative analysis of the blot bands. *: P<0.05 compared with C group, #: P<0.05 compared with M group, ▲: P<0.05 compared with N group. Magnification: 400X. Scale bar: 25μm.

