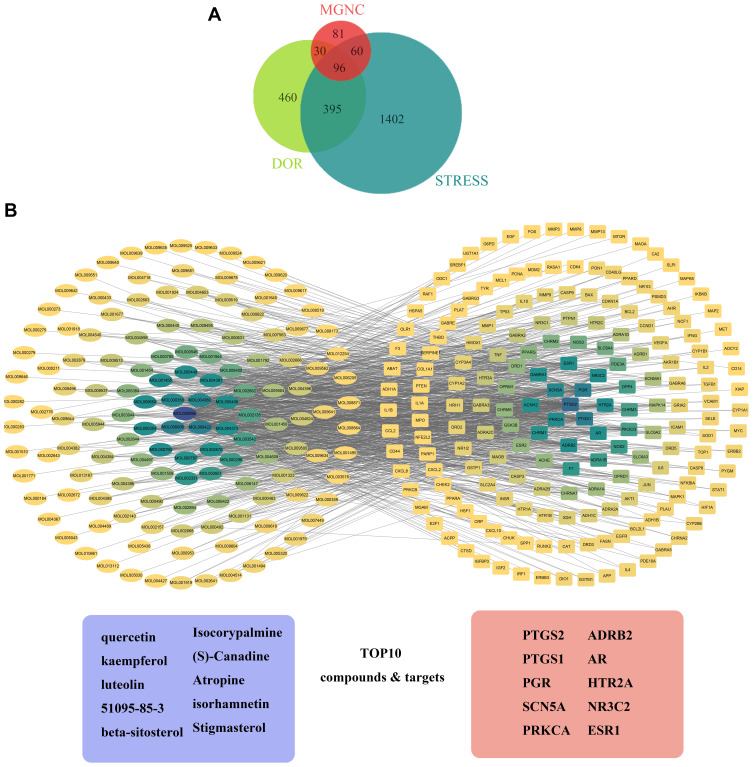
Figure 6.
Disease and MGNC target analysis and Compound-Target network of MGNC on stress-induced DOR. (A) Venn diagram of target numbers shared by MGNC formula, DOR, and psychological stress. (B) Compound-Target network of intersection targets and related active compounds. Ellipse represents active compounds, and rectangle represents intersection targets of MGNC, stress, and DOR. The depth of color represents degree of each node. The deeper degree is, the deeper the color is. The downside of the network listed nodes of compounds and targets with top 10 degree numbers.

