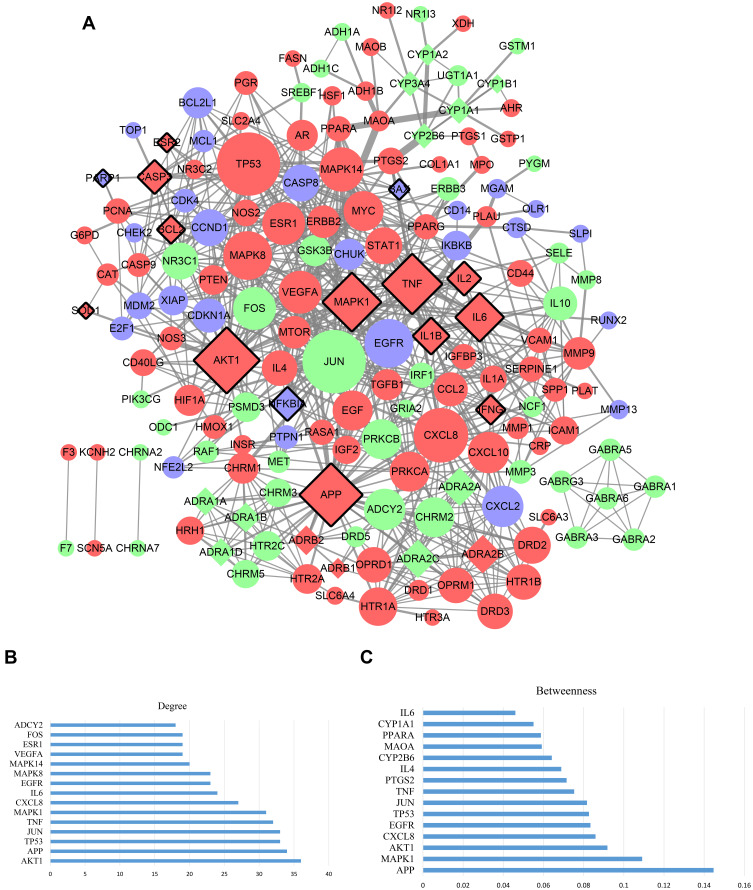
Figure 7.
Target PPI network analysis of MGNC formula. (A) PPI network of the 186 intersection targets shared by MGNC, DOR, and psychological stress. Green circles represent the 30 unique targets shared by MGNC and DOR. Blue circles represent the 60 unique targets shared by MGNC and psychological stress. Red circles represent the 96 common targets of three sets. The size of circles represents the degree of targets in the network. Diamond nodes with black border indicates previously reported targets of GNC formula. Diamond nodes without black border indicate targets verified indirectly related to GNC formula. The edge between circles represents protein interactions. Width of edges stands for the betweenness in the network. (B) Bar chart of targets with top 15 degree. (C) Bar chart of targets with top 15 betweenness.

