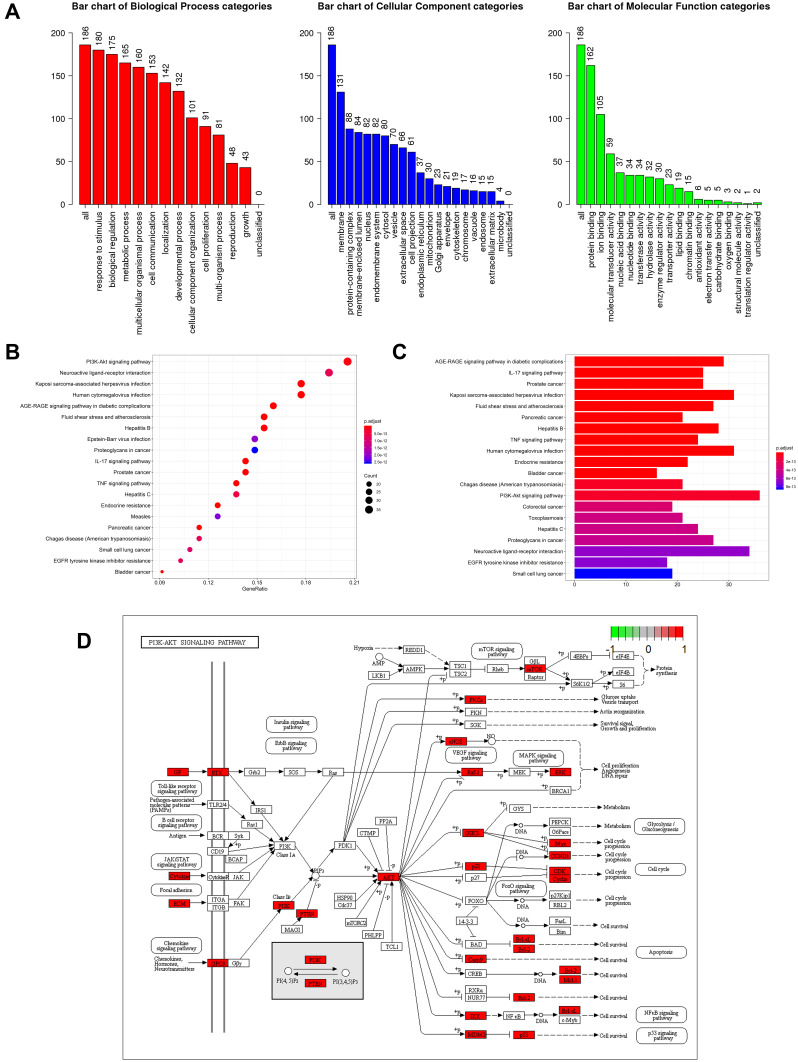
Figure 8.
Functional enrichment analysis of target genes. (A) Three ontology subset results of GO enrichment analysis.(B)Bubble chart result of KEGG enrichment analysis. (C) Bar chart result of KEGG enrichment analysis. (D) Schematic diagram of PI3K-Akt pathway, the pathway with most gene enriched. Molecules labeled in red represent targets covered by MGNC formula.

