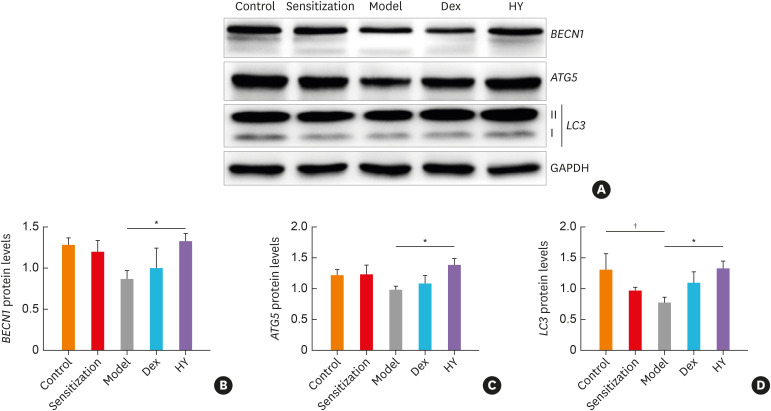
Fig. 3. HY peptide treatment induced the protein expression levels of autophagy-related genes in lung tissues of each group. (A) Representative western blot showing BECN1, ATG5 and LC3 in lung tissues from asthmatic mice following the HY peptide treatment. GAPDH serves as the reference standard. Blot is representative of 3 separate experiments. Fold-change in (B) BECN1, (C) ATG5, (D) LC3 expression following by treating with HY peptide. Values are means ± standard deviations (n = 8 per group).
Control, control group; Sensitization, sensitization group; Model, model group; Dex, dexamethasone-treated group; HY, HY peptide-treated group.
*P < 0.05 vs. control; †P < 0.05 vs. model.

