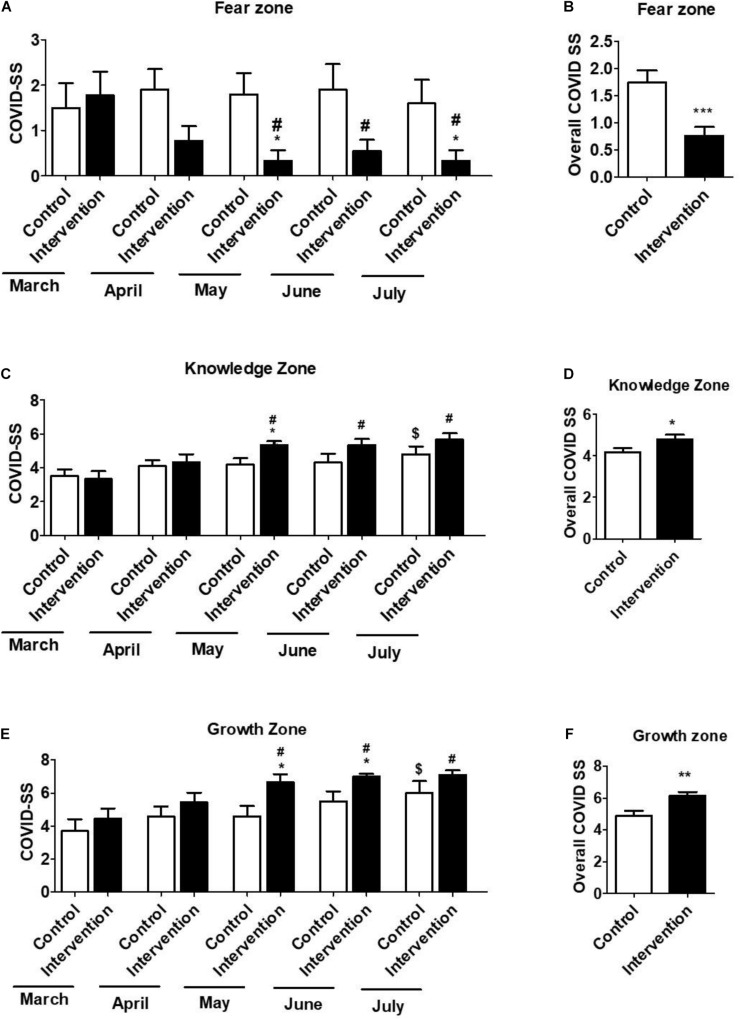
FIGURE 2.
The COVID-related stress score (COVID-SS) in the fear zone (A,B), knowledge zone (C,D), and growth zone (E,F) for March, April, May, June, and July were collected and compared between control (n = 10) and intervention (n = 9) groups. The scores of intervention and control groups in March were also compared to their respective scores of intervention and control groups in other months in each zone. The data in (B,D,F) represent Mean ± SD of overall COVID-SS scores of control (n = 50, 10 subjects for 5 months) and intervention (n = 45, 9 subjects for 5 months) groups. T-test was applied to compare the scores between months. p < 0.05, p < 0.01 are represented as “*” and “**” or “***”, respectively when compared the scores between intervention and control groups. “#” represents p < 0.05 when compared between intervention groups (March vs. other months). “$” represents p < 0.05 when compared between control groups (March vs. another month).

