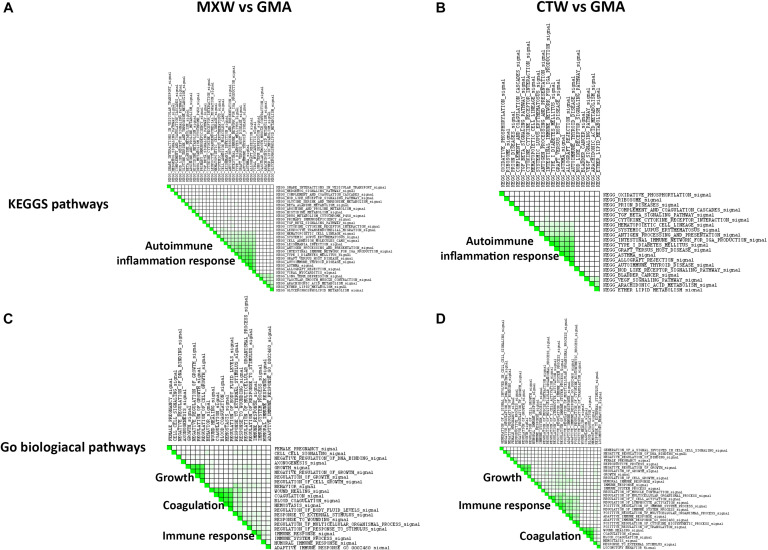
FIGURE 3.
GSEA leading edge analysis of the significantly enriched KEGG pathway (A,B) and GO Biological Processes (C,D). The results are shown as a similarity matrix where the intensity of the green color directly correlates with the extent of the intersection between the leading edge core genes of each gene set combination. (A,C) = MXW vs. GMA; (B,D) = CTW vs. GMA.

