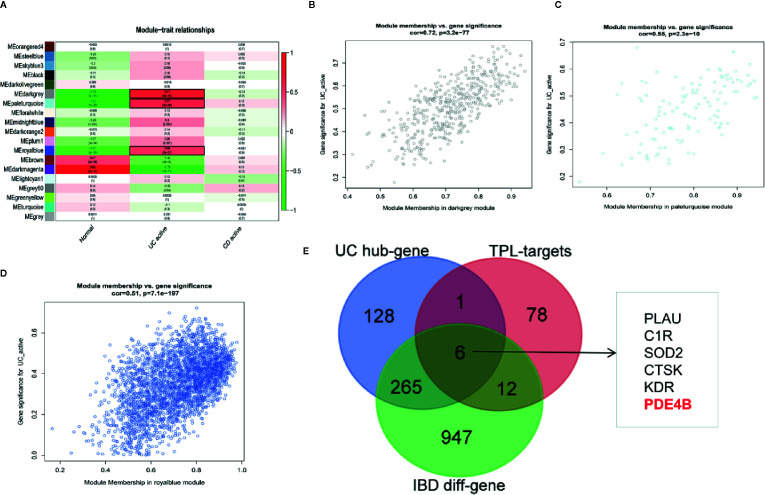
Figure 5.
WGCNA was used to identify IBD-associated modules and hub genes in inflammatory bowel diseases. The co-expressive modules of IBD are depicted (A). The correlation coefficient and p-value of (B) “dark gray”, (C) “pale turquoise”, (D) “royal blue” modules is shown (B–D). (E) The Venn diagram shows the underlying molecules of triptolide in intestinal inflammation.

