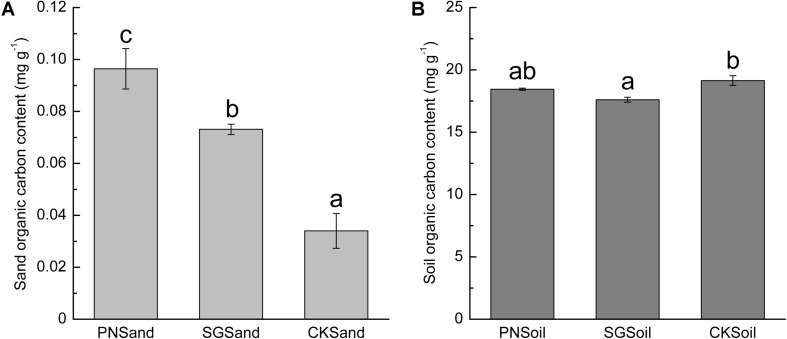
FIGURE 1.
Sand organic C (A) and soil organic C content (B) as affected by plant. Different lowercase letters indicate significant difference (Tukey HSD post hoc test, P < 0.05) among three treatments of sand samples or soil samples. The error bars show calculated standard error of triplicate samples. PN, bahiagrass; SG, stylo; CK, the unplanted control.

