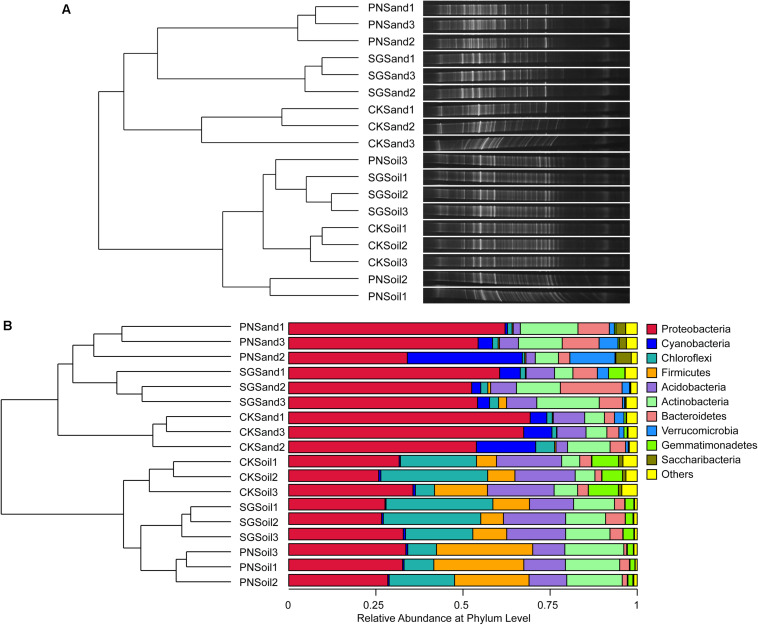
FIGURE 3.
Soil bacterial community structure and hierarchical clustering based on community composition, as revealed by bacterial 16S rRNA gene V3 DGGE band optical density profiles (A) and 16S rRNA gene V3-V4 high-throughput sequencing OTU abundance profiles (B). Hierarchical clustering dendrogram of bacterial communities were based on pairwise Bray-Curtis distance, and microbial community composition were visualized by DGGE bands and stacked bar charts of top ten phyla abundance from high-throughput sequencing. PN, bahiagrass; SG, stylo; CK, the unplanted control.

