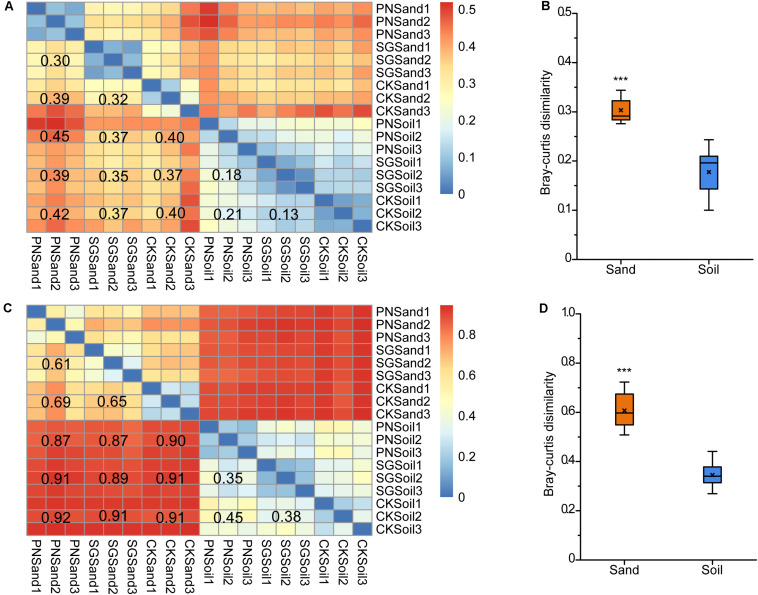
FIGURE 5.
Bacterial community pair-wise dissimilarity as affected by culture matrix and plant. Heatmaps showing pair-wise Bray-Curtis dissimilarities revealed by 16S rRNA gene V3 DGGE band optical density profiles (A) and 16S rRNA gene V3-V4 high-throughput sequencing OTU abundance profiles (C), and boxplots of community Bray-Curtis similarities between soil and sand from planted samples indicated by DGGE (B) and sequencing (D). The values noted in the heatmap show the average dissimilarities of two groups. The “×” in the boxplots indicate the averaged dissimilarity values, and the “∗∗∗” mean significant difference between soil and sand planted samples followed by t-test (P < 0.05). PN, bahiagrass; SG, stylo; CK, the unplanted control.

