
Figure 1.
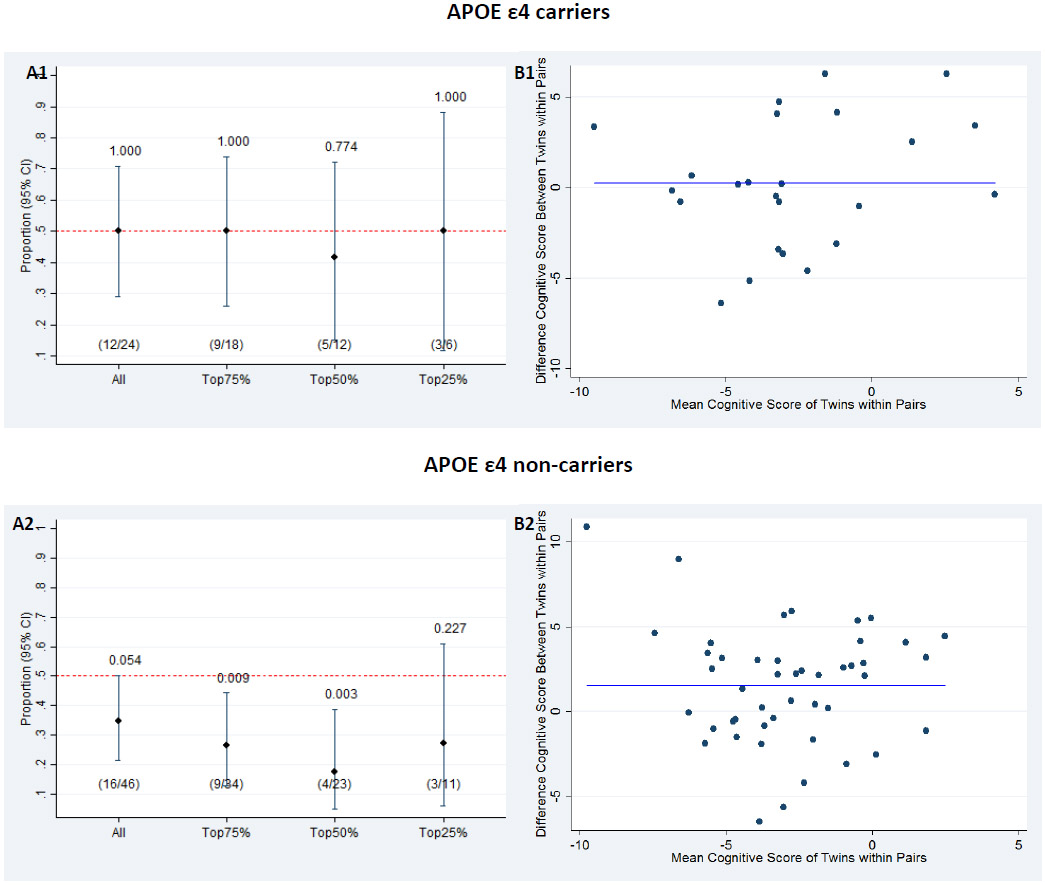
(A) Proportion of twin pairs in which the twin exposed to major surgery had a lower cognitive score for all twin pairs and stratified according to the magnitude of intra-pair difference in cognitive score, separately for APOE ε4 carriers (A1) and non-carriers (A2). Above each line is the p-value from the binomial test, which tests whether the proportion equals to 0.5. (B) Bland Altman plot of difference in cognitive score between the twins (twin exposed to major surgery – twin not exposed to major surgery), separately for APOE ε4 carriers (B1) and non-carriers (B2). The solid blue lines represent the mean difference in cognitive score between twins exposed to major surgery and twins without surgery (mean 0.10 (B1) and 0.42 (B2)).