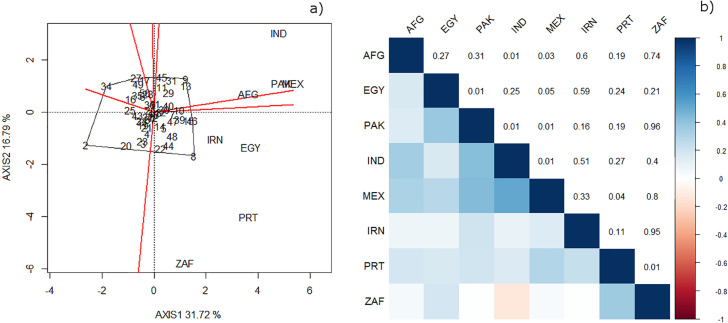
Fig. 7.
(a) Polygon in the biplot of the site regression analysis displaying the best performing wheat genotypes in the countries with locations classified as Megaenvironment 1 (ME1); (b) Pearson correlations (below the diagonal) among the countries in which locations were classified as ME1 and p-values of the correlations (above the diagonal). AFG, Afghanistan; EGY, Egypt; PAK, Pakistan; IND, India; MEX, Mexico; IRN, Iran; PRT, Portugal; ZAF, South Africa.

