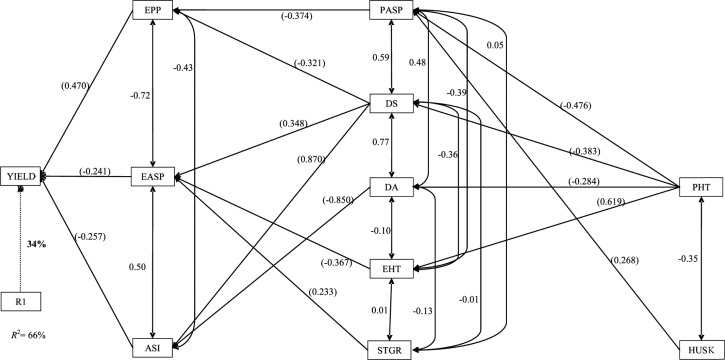
Fig. 1.
Path analysis model diagram showing causal relationships of measured traits of early-maturing S1 lines developed from cycle C0 of TZE-Y Pop DT STR evaluated under drought stress at Ikenne during the 2010–2011 and 2011–2012 dry seasons in Nigeria. The bold value is the residual effect. Values in parentheses are direct path coefficients, whereas other values are correlation coefficients. R1, residual effects; ASI, anthesis–silking interval; DA, days to 50% anthesis; DS, days to 50% silking; EASP, ear aspect; EPP, ears per plant; HUSK, husk cover; PASP, plant aspect; PHT, plant height; STGR, stay green characteristics; YIELD, grain yield.

