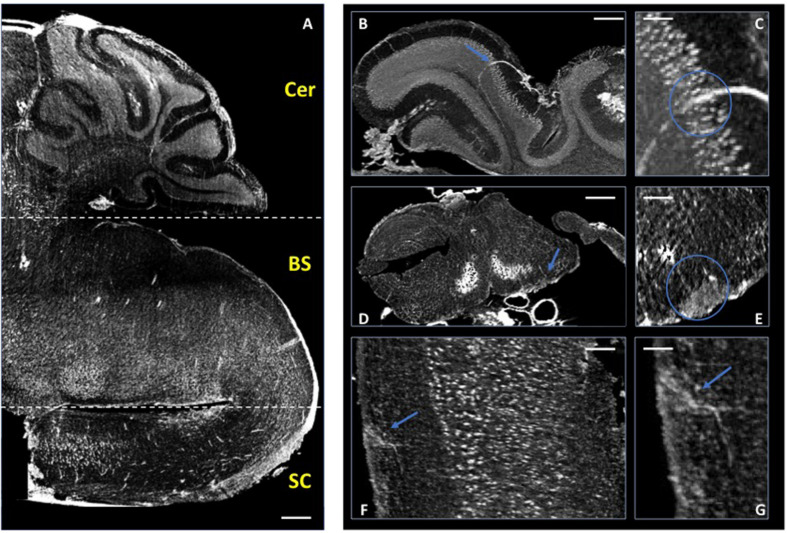
FIGURE 5.
Micro-XPCT imaging of EAE-affected mouse CNS. (A) Micro-XPCT image showing a sagittal view of the cerebellum (Cer), brain stem (BS), and cervical section of the spinal cord (SC) of an EAE-affected mouse at disease onset (MAX over 150 μm; scale bar, 300 μm). (B,C) Micro-XPCT image of a detail of vessel in the cerebellum is shown in (B), with a zoomed image of the same region shown in (C) (MAX over 130 μm; scale bar, 100 and 50 mm, respectively). (D,E) Inflammatory lesion with BBB leakage in the brain stem (D) zoomed in (E) (MAX over 65 μm; scale bar, 350 and 100 μm, respectively), and in the cervical portion of spinal cord (F), zoomed in (G) (MAX over 30 μm; scale bar, 90 and 50 μm, respectively). Blue arrows indicate lesions, with blue circles encompassing the vessels and extravasated material. Images were acquired at ANATOMIX, Soleil.

