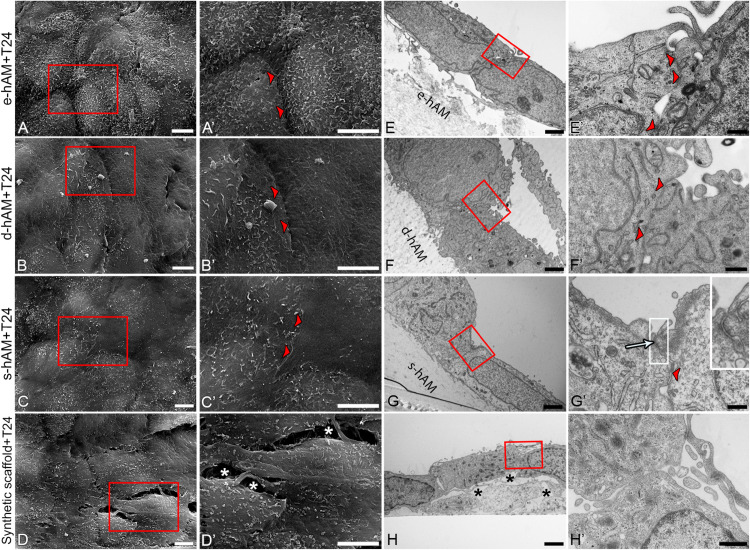
FIGURE 7.
Ultrastructure of T24 cells on hAM and synthetic scaffolds. Scanning (A–D’) and transmission (E–H’) electron microscopy images are represented. T24 cells are tightly attached (arrowheads) to each other on hAM scaffolds in contrast to synthetic scaffolds where large intercellular spaces were observed (white and black asterisks, D’,H). Tight junction is formed between T24 cells on s-hAM (arrow, G’). Images show T24 cells on hAM scaffolds and synthetic scaffolds after 3 weeks in culture. Large inset framed with white lines show 200% enlarged image of corresponding small white framed inset (G’). Red frames mark enlarged areas shown in (A’–D’) and (E’–H’), respectively. Scale bars: (A–D,A’–D’) 5 μm; (E–H) 2 μm; (F’,H’) 600 nm, (E’) 400 nm, and (G’) 100 nm.

