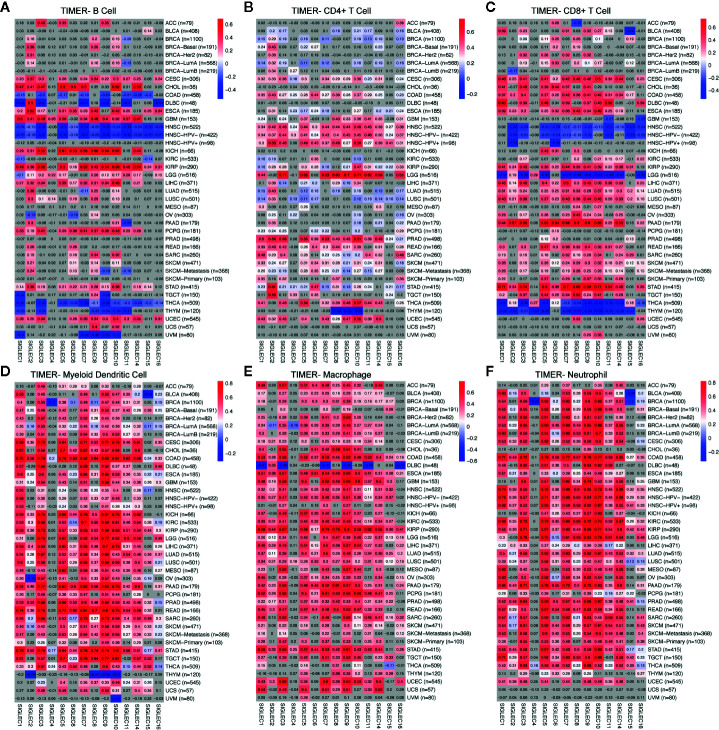
Figure 7.
Coefficients for correlation between SIGLEC family genes and immune cell infiltration of different tumors in TIMER database. (A). Coefficients for correlation between B cell infiltration score and SIGLEC family genes in different tumors. (B). Coefficients for correlation between CD4+ T cell infiltration score and SIGLEC family genes in different tumors. (C). Coefficients for correlation between CD8+ T cell infiltration score and SIGLEC family genes in different tumors. (D). Coefficients for correlation between myeloid dendritic cell infiltration score and SIGLEC family genes in different tumors. (E). Coefficients for correlation between macrophage infiltration score and SIGLEC family genes in different tumors. (F). Coefficients for correlation between neutrophil infiltration score and SIGLEC family genes in different tumors. (Coefficients with significance were marked with bright colors, while non-significant coefficients were marked with grey background. P value under 0.05 was considered significant. The association was generated with tumor purification adjusted.)

