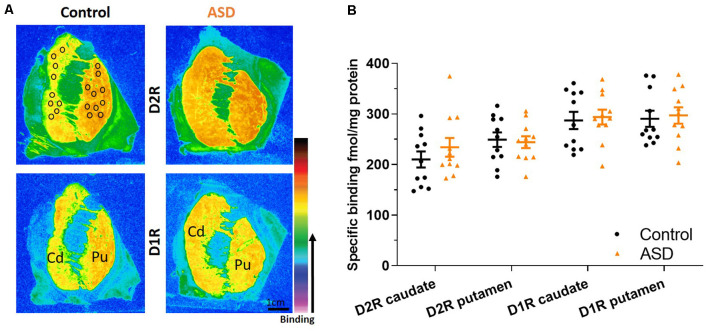
Figure 3.
(A) Representative images of control and ASD cases for ligand binding with warmer colors indicating higher binding. Black circles over the control case represent typical sampling areas, where we chose only representative areas with appropriate binding levels for quantification and can be applied to all binding images. (B) D2 and D1 receptor expression labeled with tritiated isotopes are similar between ASD (orange) and controls (black) in the caudate/putamen. n = 11 control, 11 ASD.

