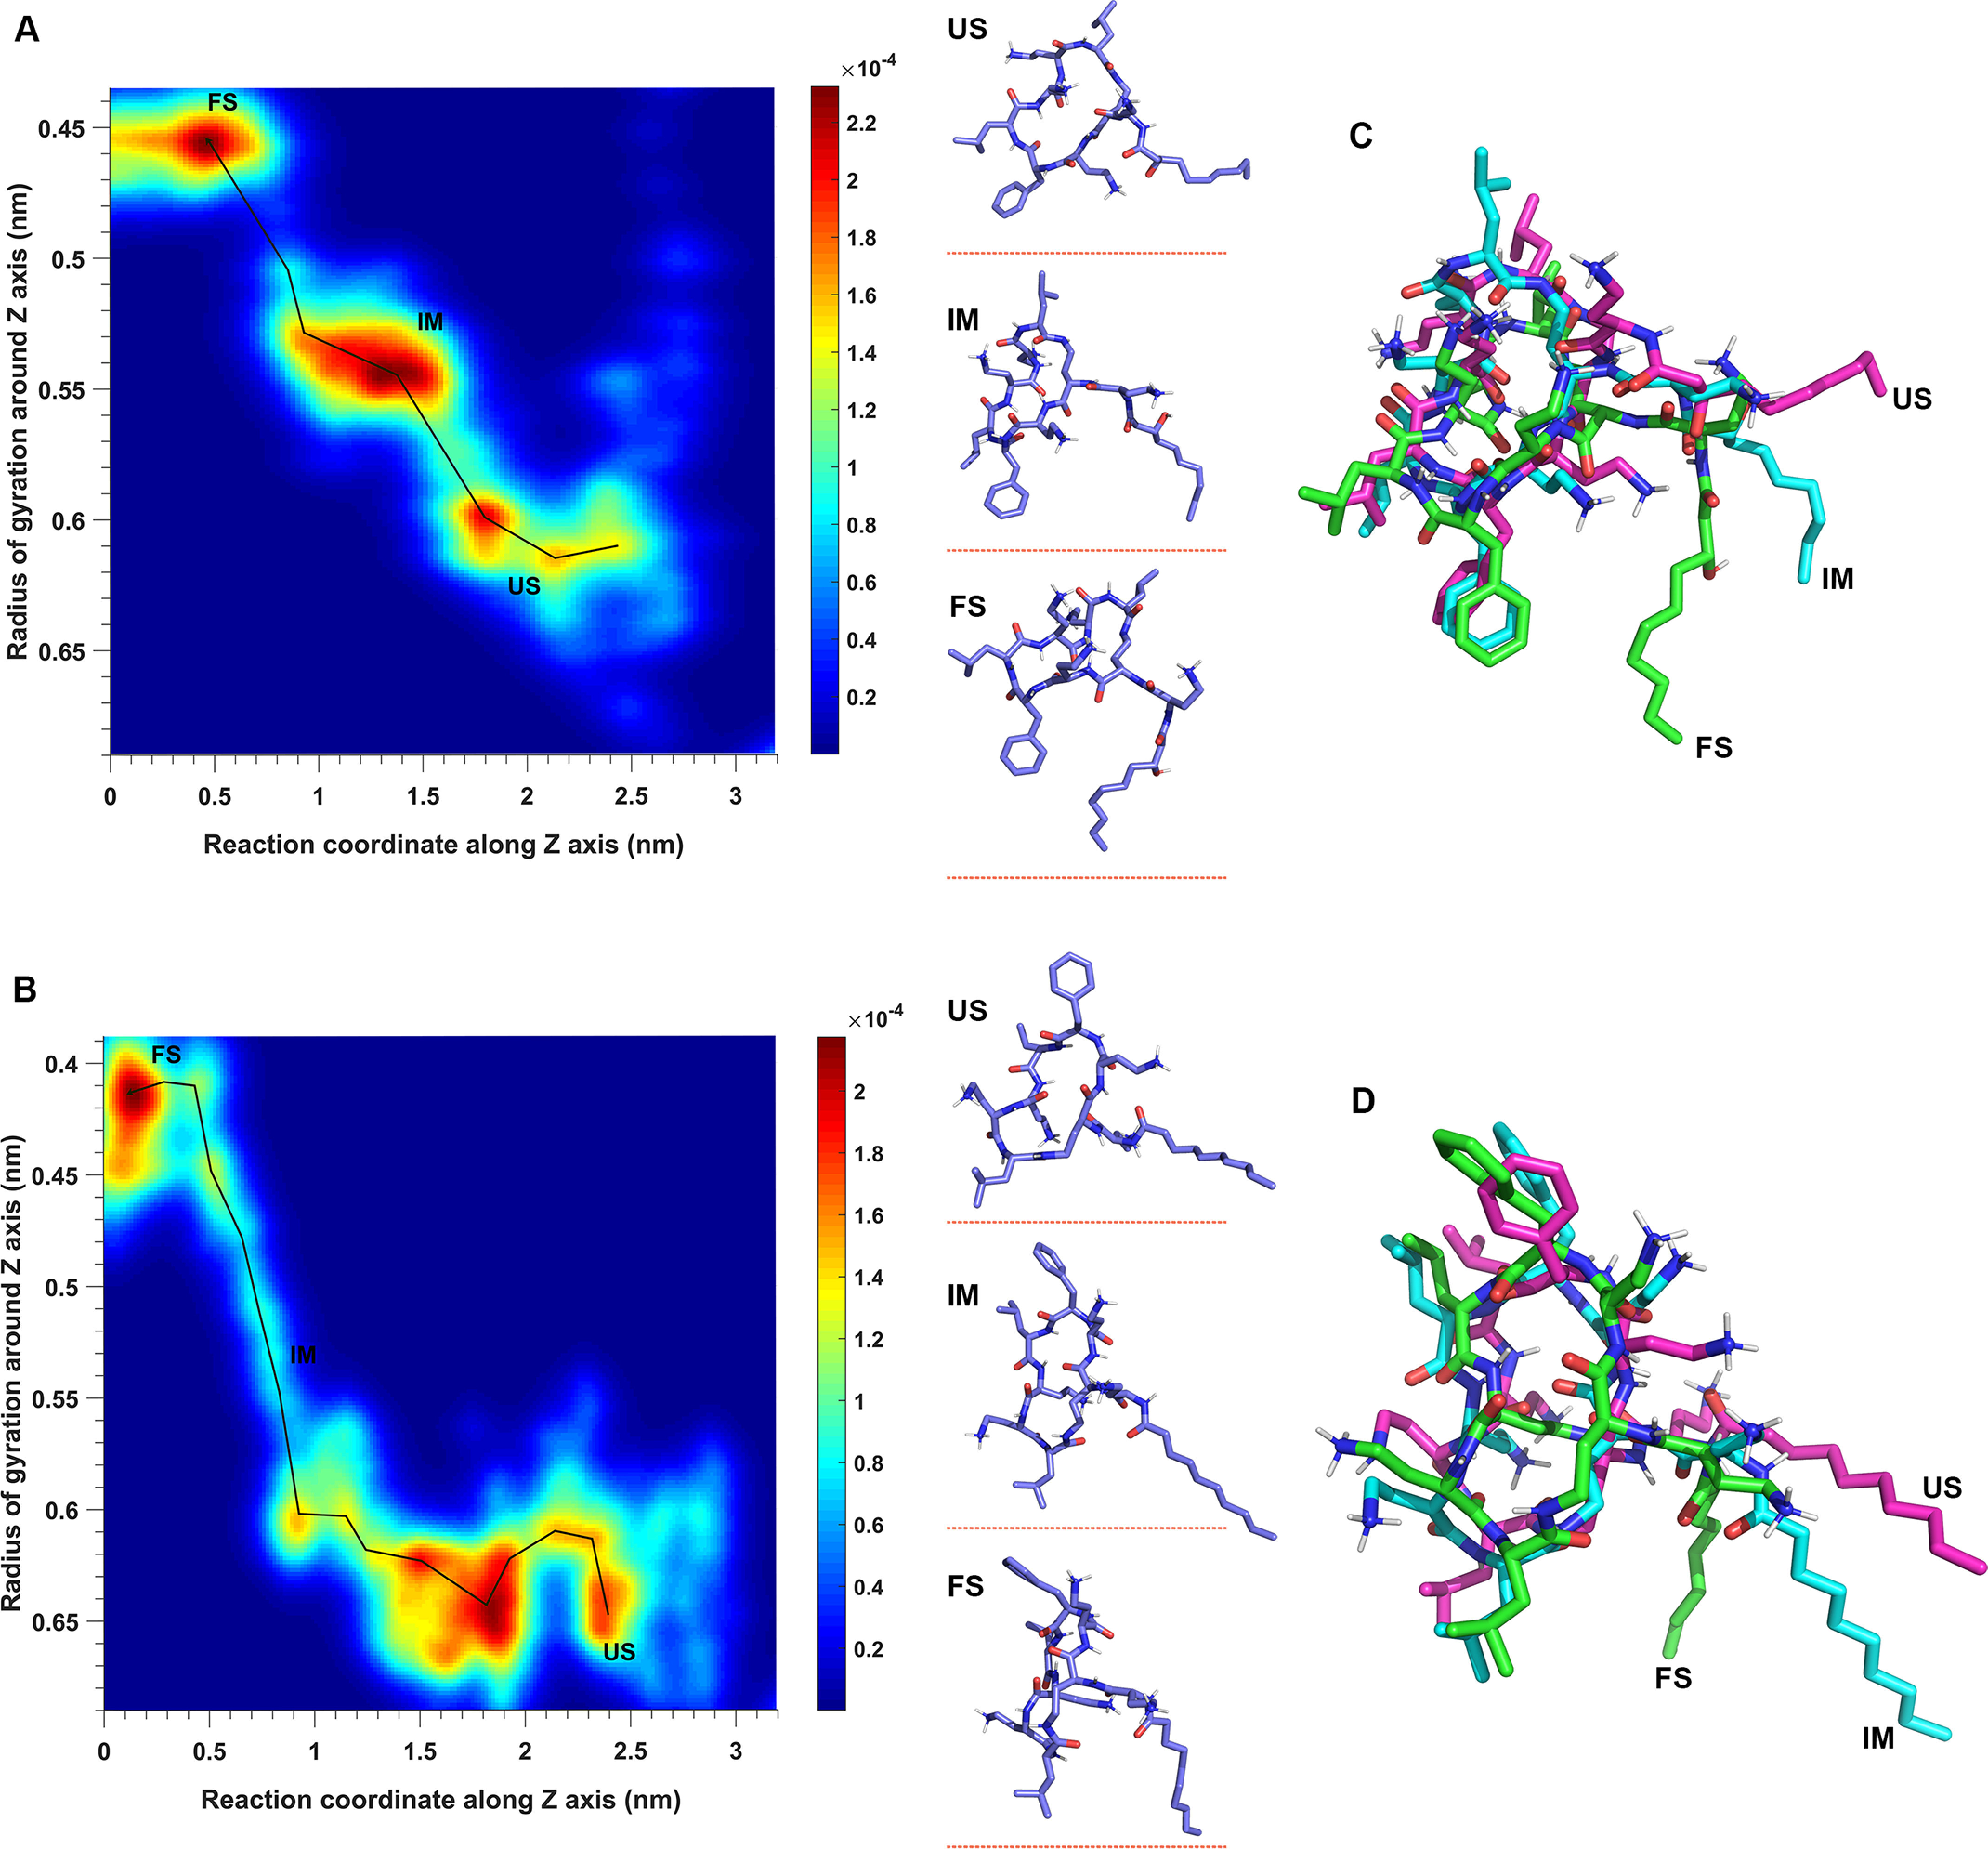
Figure 5.

Conformational dynamics of octapeptin C4 (A) and FADDI-115 (B) in the outer membrane, with the superimposition of the octapeptin molecule at different conformational states shown for octapeptin C4 (C) and FADDI-115 (D). The conformational landscape is defined by sampling the radius of gyration of the octapeptin molecule around the z axis and the reaction coordinates of the penetration. The conformations of the octapeptin molecule are represented by points, and the color spectrum represents the density of points. The pathway of conformational transition from the unfolded state (US) to intermediate state (IM) and folded state (FS) is shown by a black line.
