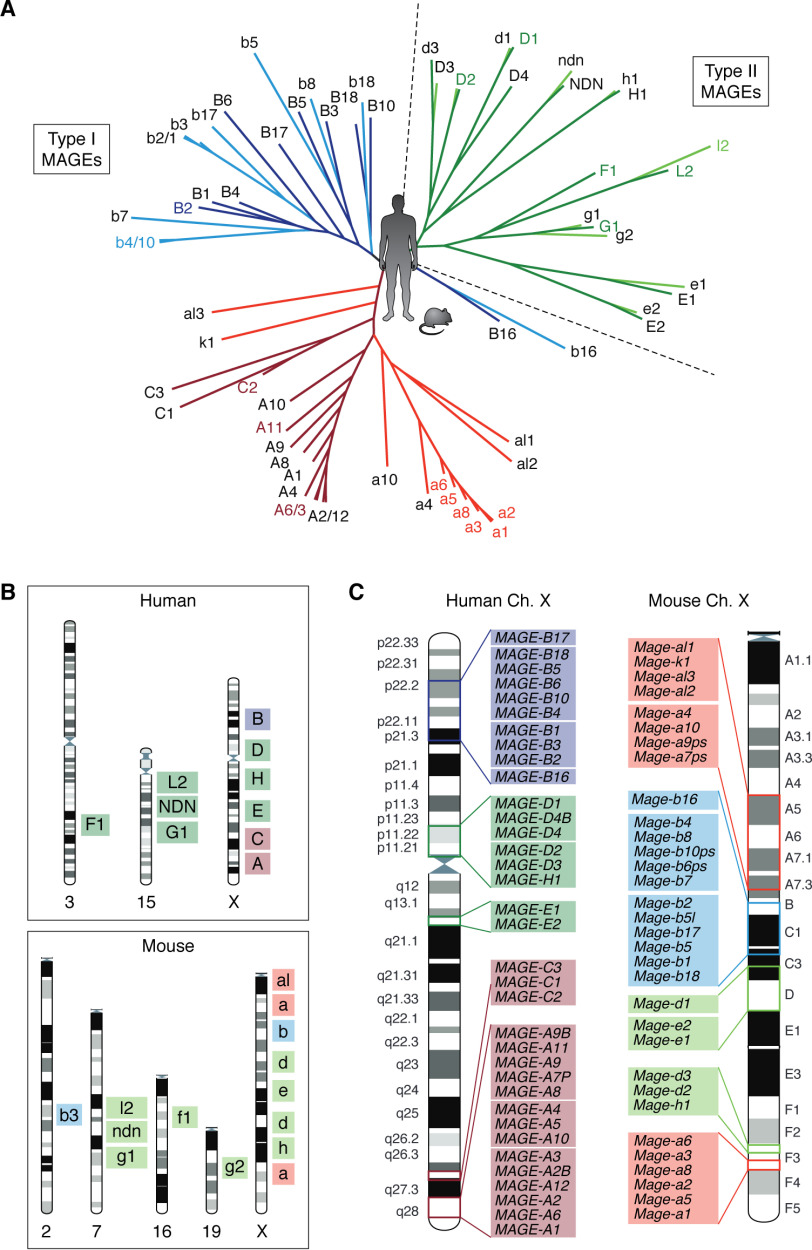
Figure 1.
Overview of the MAGE gene family in humans and mice. A, phylogenetic tree showing the relationship between human and mouse MAGE proteins. The tree was created by the neighbor-joining construction method using the Jukes–Cantor protein distance measurement from the CLC Main Workbench 20. B, chromosomal location of human and mouse MAGE genes. C, locations of MAGE genes on the human and mouse X chromosome based on the recent NCBI's genome assembly HRCh38.p13 and GRCm38.p6. For all figures, the type II MAGEs are represented in green, MAGE-A and -C subfamilies in red, and MAGE-B subfamily in blue. Light colors indicate mouse Mages and dark colors indicate human MAGEs.

