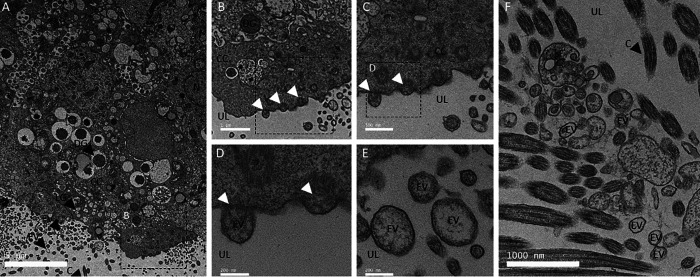
Figure 1.
TEM of uterine cells. A, TEM micrograph of uterine epithelium showing secretory activity (16 h p.o.). B–D, higher magnification TEM micrographs of uterine cells showing examples of exocytosis activity. E and F, TEM micrographs illustrating the presence of numerous EVs in the uterine lumen (UL) at 7 (F) and 16 h p.o. (E). Thin sections of uterus were negatively stained with 2% uranyl acetate. C, cilia; CC, ciliated cells; DG, dense granule; LG, light granule; N, nucleus; UL, uterine lumen. White arrowheads indicate vesicle budding. Bars: A = 5 μm, B and F = 1000 nm, C= 500 nm, D and E = 200 nm.

