Figure 3.

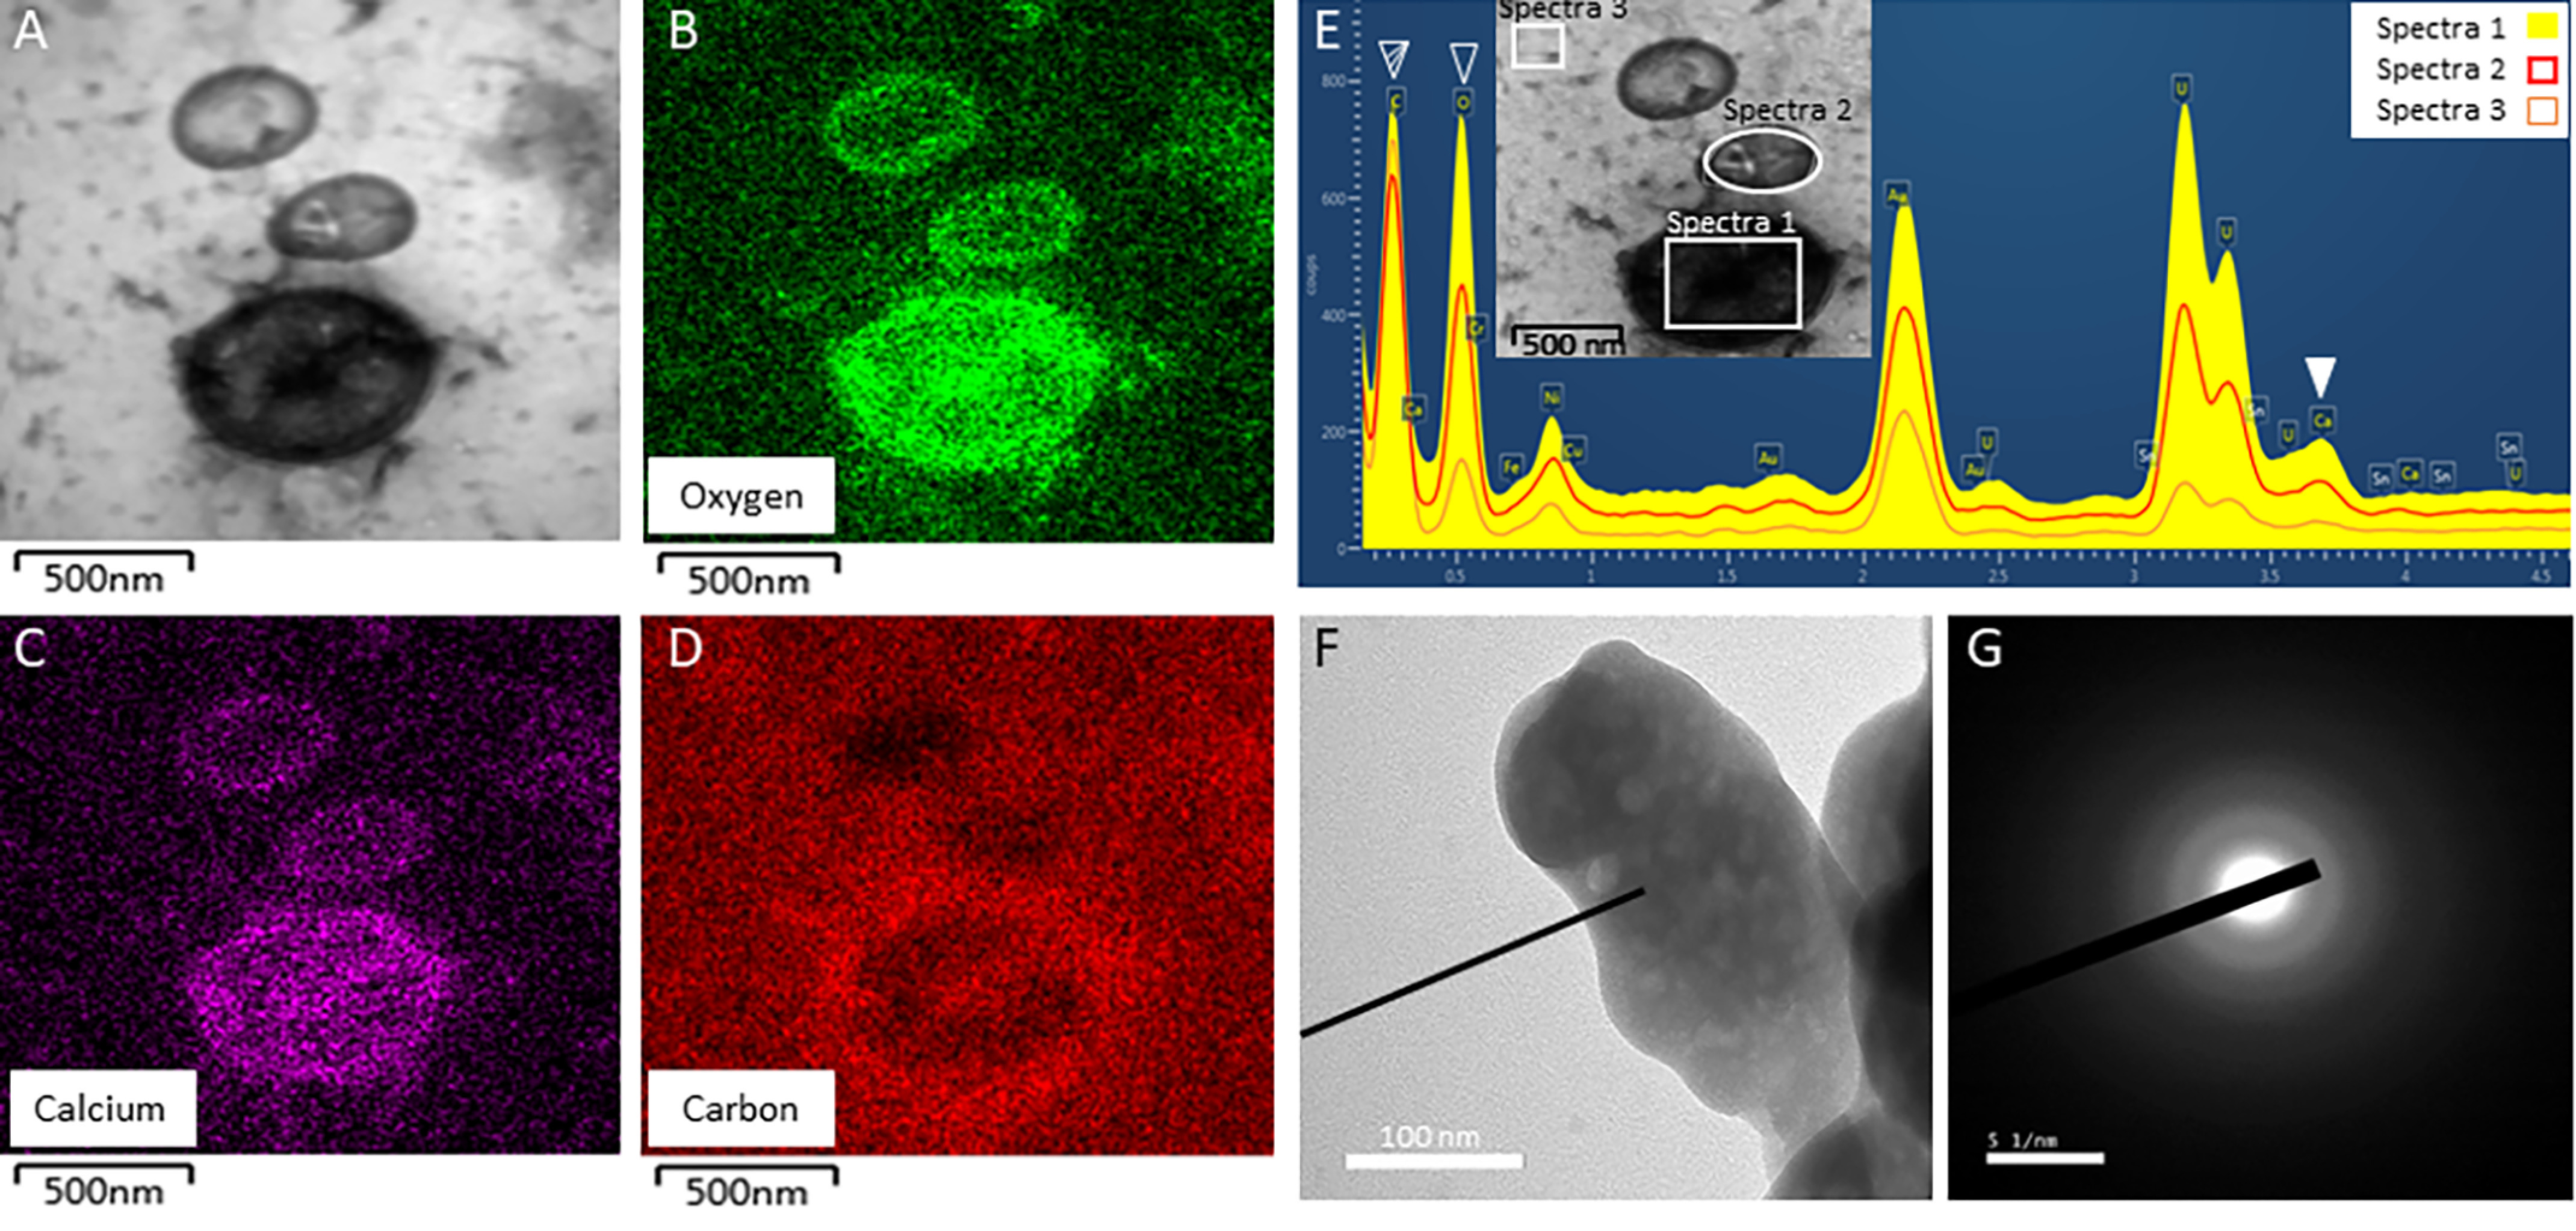
TEM on uterine fluid, EDS and SAED analyses. A, TEM of EVs observed in UF fraction at 16 h p.o. with associated mapping of (B) oxygen element, (C) calcium element, and (D) carbon element; as detected by the EDS analysis. E, EDS spectrum of the EVs observed in UF and shown in A. Filled white arrowhead indicates the calcium peak (3.690 keV) of EV, whereas striped and empty white arrowheads show carbon (0.277 keV) and oxygen (0.525 keV) peaks, respectively. Boxes point out the areas of EDS analysis. F and G, SAED pattern of the mineral detected in EV of UF. Diffuse scattering rings are characteristic of the ACC mineral. Bars: A to D = 500 nm, F = 1 μm, G = 51 nm.
