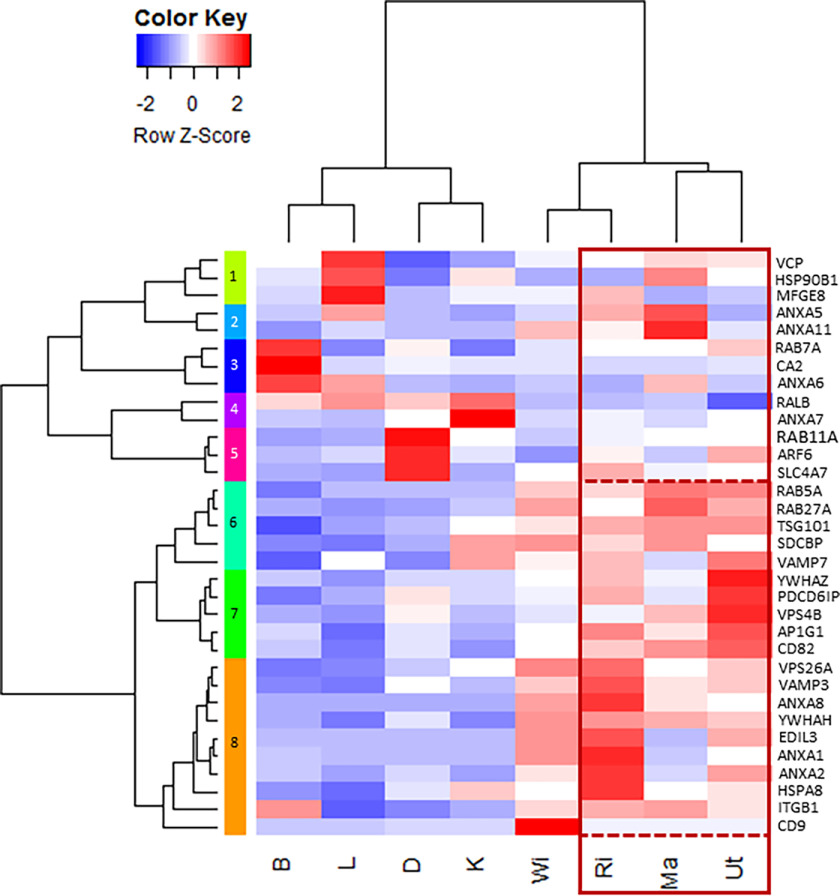
Figure 4.
Heat map of vesicular mRNA levels in the four oviduct segments (Ma, WI, RI, and Ut) and four tissues (B, bone; D, duodenum; K, kidney; L, liver). Z-score range was colored from blue (−2 Row, Z-Score, low mRNA level) to white (0 Row, Z-Score, intermediate mRNA level) and to red (2 Row, Z-score, high mRNA level). Gene accessions and primers are reported in Table S3.

