Figure 2.

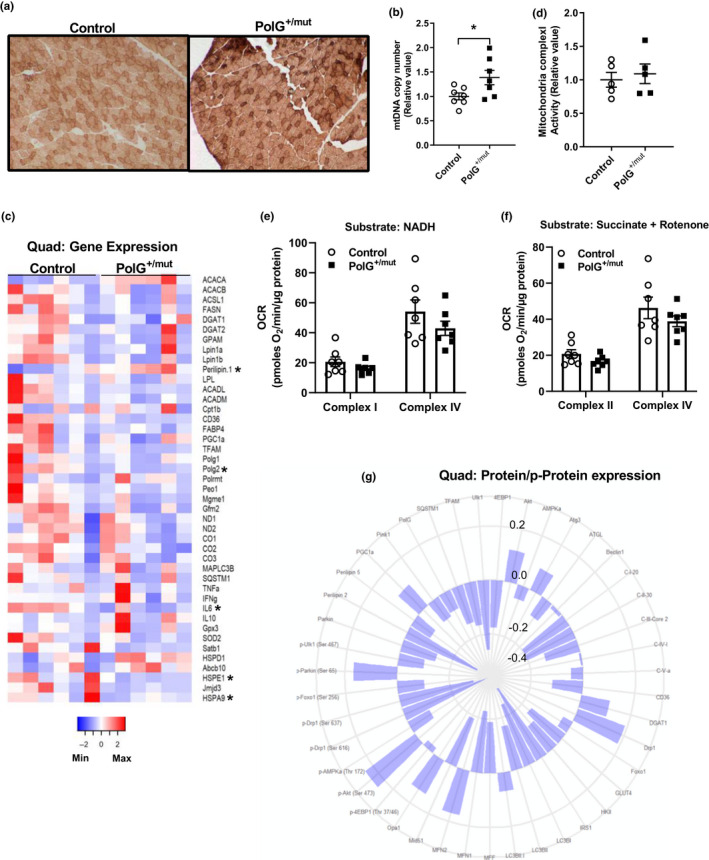
Increased mtDNA point mutations in muscle increase mtDNA copy number. (a) Cytochrome C oxidase (COX)‐positive fibers (darker brown) in muscle sections from the tibialis anterior with representative images from each group. (b) Mitochondrial DNA copy number in quadriceps muscle of PolG+/mut versus normalized Control. (c) Heat map of mRNA expression in quadriceps muscles normalized to Control. (d) Mitochondrial complex 1 activity in gastrocnemius muscle and normalized to Control. (e–f) Oxygen consumption rates from complex I and complex IV in quadriceps muscle expressed as picomoles of oxygen/minute/ microgram of protein using NADH or succinate + rotenone as substrates. (g) Polar histogram of fold change in protein/phosphoprotein expression in whole quadriceps muscle lysates of PolG+/mut over Control. Protein name depicted at edge with each successive circle representing a 0.2‐, 0.0‐, ‐0.2‐, or ‐0.4‐fold change compared with Control. Values are expressed as means ± SEM, and mean differences were detected by Student's t test. *p < .05, significantly different from Control. N = 4–7/group
