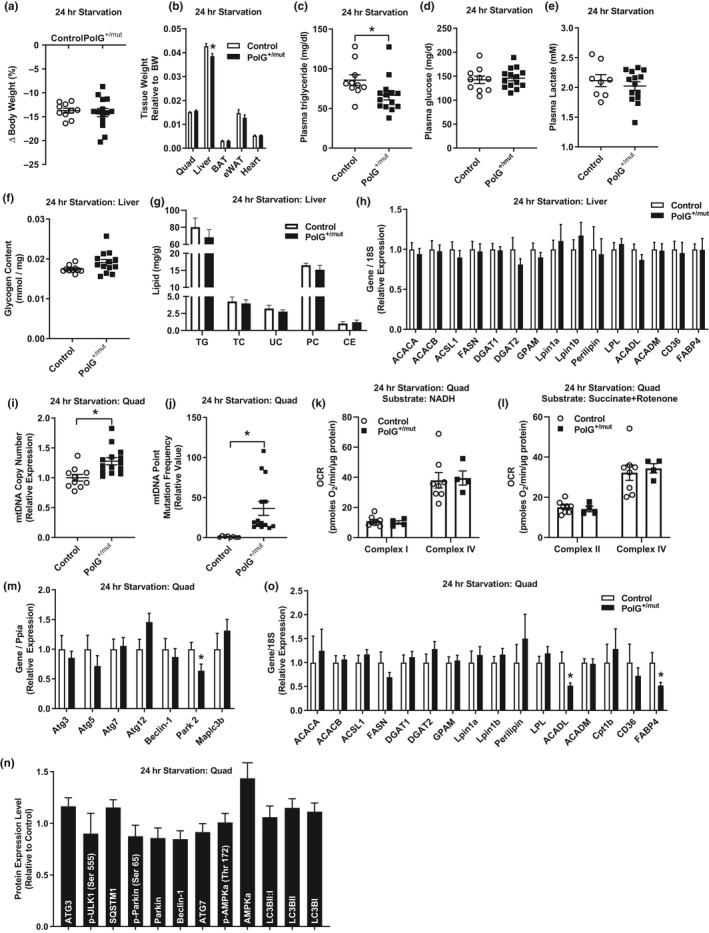
Figure 3.

Increased mtDNA point mutations do not alter metabolic response to 24‐hr starvation. (a) Change in body weight and (b) wet tissue weights in PolG+/mut versus Control following 24‐hr starvation. (c–e) Plasma triglycerides, glucose, and lactate levels. (f) Hepatic glycogen content expressed relative to g of tissue. (g) Hepatic lipid concentration expressed as milligram of lipid/ gram of liver (TG, triglyceride; TC, total cholesterol; UC, unesterified cholesterol; PC, phosphatidylcholine; CE, cholesterol ester). (h) Hepatic gene expression relative to Control normalized to 1.0. (i) Mitochondrial DNA (i) point mutation frequency and (j) copy number in quadriceps muscles from PolG+/mut versus normalized Control. (k–l) Measurement of oxygen consumption rate from complex I and complex IV in quadriceps muscle expressed as picomoles of oxygen/ minute/ microgram of protein with either NADH or succinate + rotenone as substrates. (m–n) Gene and protein/phosphoprotein expression of mitophagy markers in quadriceps muscle from PolG+/mut relative to normalized Control following 24‐hr starvation. (o) Expression of genes regulating lipid metabolism in PolG+/mut relative to normalized Control. Values are expressed as means ± SEM, and mean differences were detected by Student's t test. *p < .05, significantly different from Control. N = 8–14/group
