Figure 1.

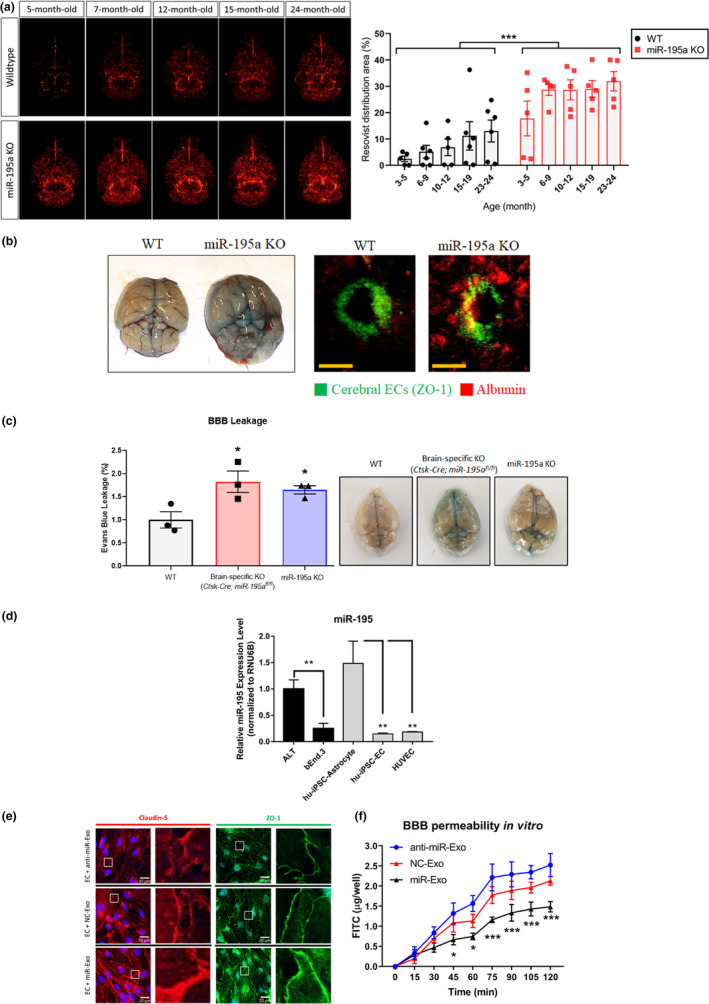
miR‐195 enhanced BBB integrity via astrocyte‐derived‐exosomes. (a) MRI images showing more BBB leakage of miR‐195a knockout (KO) mice compared to wild‐type (WT) mice regardless of age. The intensity of the red signals represents the amount of Resovist extravasation in the brain parenchyma which implicated the severity of BBB leakage. ***p < 0.001, n = 5–6/group. (b) Representative images showing the Evans blue extravasation in the whole brain (left panel) and serum albumin extravasation (red) in the brain parenchyma (right panel) of miR‐195a KO mice and the WT littermate at the age of 4 months. Cerebral ECs were stained for ZO‐1 (green). Magnification: 200×. Scale bar = 20 μm. See quantitative data in Figure S1C. (n = 3/group) (c) BBB permeability measured by Evans blue assay in WT, brain‐specific KO (Ctsk‐Cre;miR‐195afl / fl), and miR‐195a KO mice aged 12 months (left panel). Data are presented as mean ± SEM, *p < 0.05, n = 3/group. Representative images show Evans blue extravasation in whole brains of mice of three types (right panel). (d) miR‐195 levels in astrocytes and ECs. Data are presented as mean ± SEM from three independent experiments, and each experiment was performed in triplicate. *p < 0.05; **p < 0.01. (e) Confocal immunofluorescence showing changes in the claudin‐5 (red) and ZO‐1 (green) expression especially in the cell–cell contact site at 72 h post‐exosome treatment. The experiment was repeated in triplicate. Magnification: 200×. Scale bar = 20 μm. (F) The in vitro BBB model of FITC–dextran permeability in cultured ECs subjected to the transfection with miR‐195 mimic (miR‐Exo), miR‐195 anti‐sense (anti‐miR‐Exo), or negative control (NC‐Exo) miRNA. Data are presented as the mean ± SEM from three independent experiments. *p < 0.05; **p < 0.01; ***p < 0.001 versus the corresponding time point of NC‐Exo
