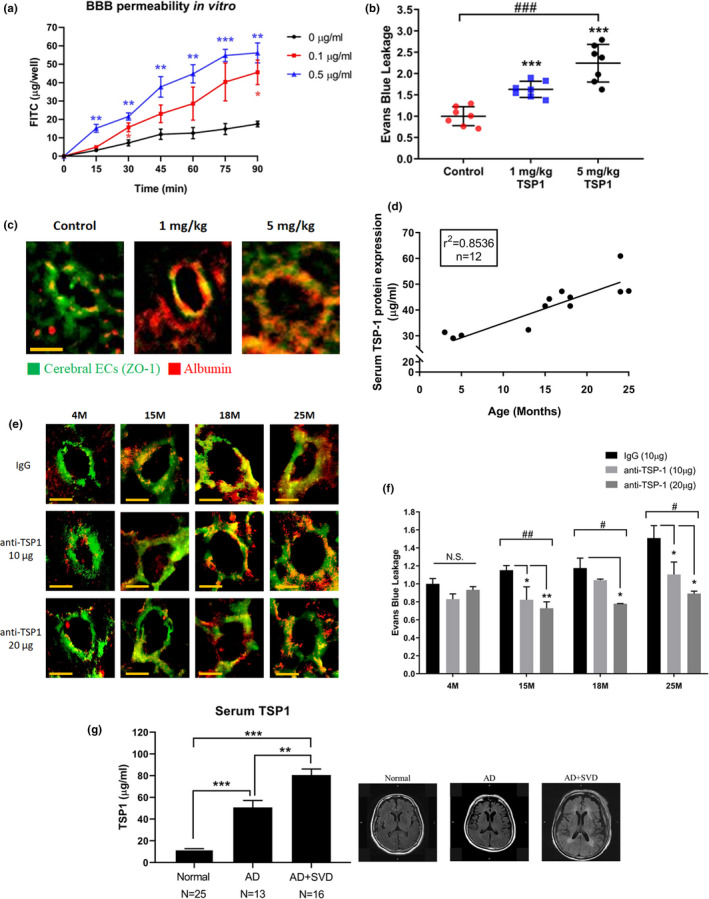
Figure 3.

Serum TSP1 levels increased with age and led to BBB disruption. (a) TSP1 treatment exacerbated FITC–dextran leakage in an in vitro model. The corresponding time points in the untreated cells were used as the reference. (b) TSP1 was IV injected to mice, and BBB permeability was determined by extravasation of Evans blue on day 5. n = 7/group. (c) Extravasation of serum albumin (red) in TSP1 IV injected mice. Cerebral ECs were stained for ZO‐1 (green). Magnification: 200×. Scale bar = 20 μm. (d) Serum TSP1 levels measured by ELISA increase with age in C57BL/6 mice. See also Figure S3D. (e) IV injection of TSP1 antibody to neutralize serum TSP1. The histology analysis was used to evaluate BBB leakage on day 5. Extravasation of serum albumin (red) and cerebral ECs (green), n = 3/group. (f) Evans blue assay was used to quantify the effect of TSP1 antibody on BBB leakage. TSP1 antibody was IV injected to neutralize serum TSP1, and Evans blue assay was performed on day 5. n = 3/group. (g) Serum TSP1 levels in patients with and without small vessel disease (SVD) were measured by ELISA. The representative MRI images of patients are shown in the right; see also figure S3E. Normal, healthy control; AD, Alzheimer's disease; SVD, small vessel disease. Data are presented as the mean ± SEM. *p < 0.05; **p < 0.01; ***p < 0.001 using t test. #p < 0.05; ##p < 0.01; ###p < 0.001 for multiple group comparison using one‐way ANOVA
