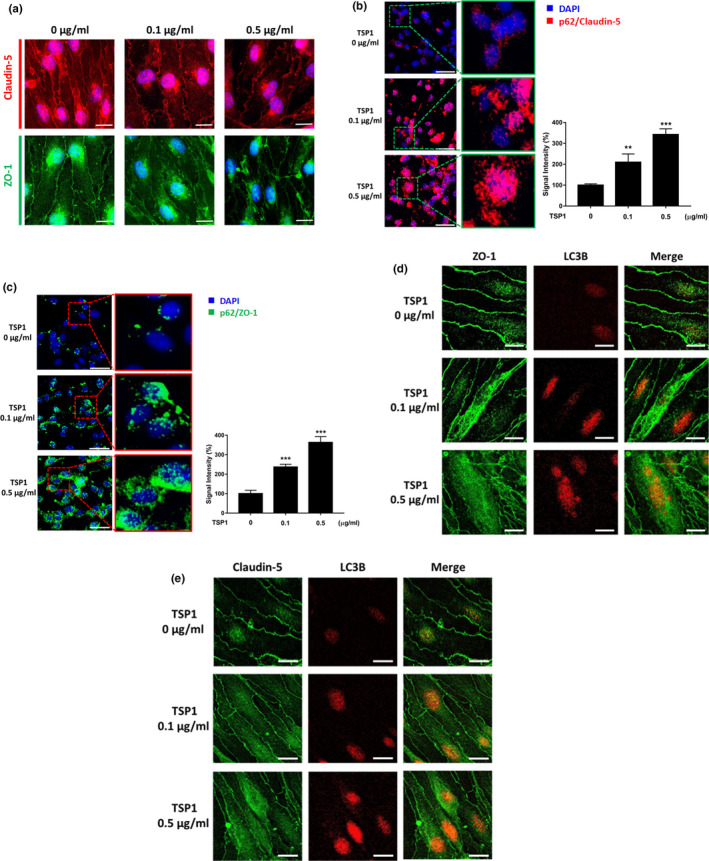
Figure 4.

TSP1‐induced selective autophagy to catabolize TJ proteins. (a) Confocal immunofluorescence analysis showed TSP1 diminished claudin‐5 (red) and ZO‐1 (green) expression in the cytoplasm of ECs and EC‐EC contact sites at 72 h post‐TSP1 treatment. Magnification: 200×. Scale bar = 20 μm. (b, c) p62‐TJ protein interactions were determined on TSP1‐treated ECs by the proximity ligation assay (PLA). PLA was performed in the TSP1‐treated ECs for 24 h. The red and green signals, respectively, represent p62/claudin‐5 and p62/ZO‐1 interaction in ECs. The PLA results are shown in the left and the quantitative data in the right. See also Figure S4B,C. (d, e) The confocal images show TSP1‐induced translocation of TJ proteins in ECs at 24 h. The TJ proteins were labeled with antibodies, and autophagosome was labeled with LC3B. In the left panel, the immunofluorescent images show that TJ proteins were redistributed from cell–cell contact sites to the cytoplasm in a dose‐dependent manner. In the middle and right panels, the cytoplasmic TJ proteins were co‐localized with LC3B, suggesting that TSP1 induces internalization of TJ proteins into autophagosomes. Data are presented as mean ± SEM from three independent experiments. **p < 0.01; ***p < 0.001
