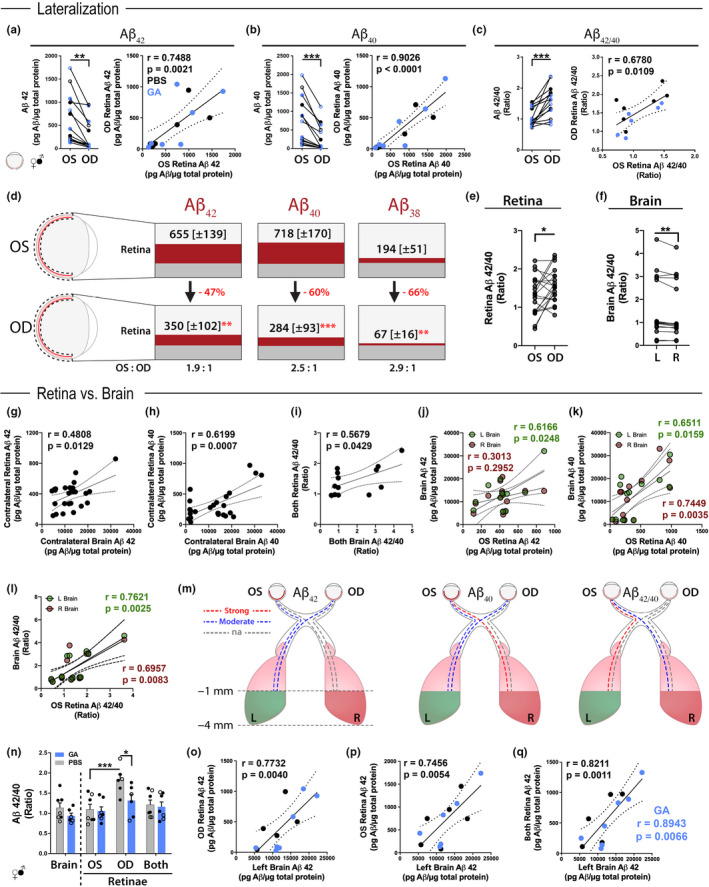
Figure 2.

Retinal and cerebral Aβ alloforms in old ADtg mice and following immunotherapy. (a–c) Analysis of Aβ1–42, Aβ1–40, and Aβ42/40 ratio levels (n = 7 mice per group) in OS versus OD retinae from Cohort 1 of GA‐immunized (blue) and PBS‐control (black) old ADtg mice. Data indicate Aβ concentrations for individual mouse in OS versus OD retina analyzed by paired Student's t test. Pearson's r correlations between levels of each Aβ1–42, Aβ1–40, and Aβ42/40 ratio in OS and OD retinae are also shown (n = 13–14 mice; right graphs). (d) Schematic display of Aβ1–42, Aβ1–40, and Aβ1–38 alloform concentrations (Average; ± SEM in brackets) in each retina from Cohort 1. Data presented in pg Aβ per µg total protein. Lower percentages of amyloid levels in OD versus OS retinae are shown in red, and OS to OD ratios of Aβ concentrations are indicated below. (e–f) Aβ42/40 ratios as assessed by MSD analysis in paired OS versus OD retinae from ADtg mice (e; Cohorts 1 and 2 without GA group; n = 20 mice) and in paired L versus R brains from Cohort 2 ADtg mice (f; n = 15 mice). Lateralization was determined by paired Student's t test. (g–m) Pearson's r correlations between retinal and cerebral Aβ burden in ADtg mice from Cohort 2. (g–h) Contralateral correlations between OS retina versus R brain and OD retina versus L brain for (g) Aβ42 and (h) Aβ40 levels (n = 12–14). (i) Correlation between average retinal and average cerebral Aβ42/40 ratios. (j–l) Unilateral correlations of OS retina versus L brain (green) or versus R brain (red) for (j) Aβ42, (k) Aβ40, and (l) Aβ42/40 ratio (n = 13). (m) Schematic illustration portraying strength of associations between each retina and each posterior brain for Aβ42, Aβ40, and Aβ42/40 ratio in old ADtg mice. The analyzed posterior brain includes tissue between −1 and −4 mm bregma. Strong associations in red (r > 0.7), moderate associations in blue (r = 0.5–0.7), and weak or no associations (na) in gray (r = 0.0–0.5). (n–q) Analysis of retinal versus cerebral Aβ levels in Cohort 1 old ADtg mice following GA immunization. (n) Brain and retinal Aβ42/40 ratios in PBS‐control versus GA‐immunized ADtg mice (n = 7 mice per group). (o–q) Pearson's r correlations between levels of Aβ42 in L brain and (o) OD retina, (p) OS retina, and (q) an average of both retinae (n = 14 mice). Strong correlations in Aβ1–42 burden between brain and retinal tissues are especially apparent following GA immunization (q). Graphs display individual data point for each mouse, with bar graphs also indicating group mean and standard error of mean (SEM) values. Mouse sex is designated as filled circles for males and open circles for females (gender not shown in correlation graphs). *p < 0.05, **p < 0.01, ***p < 0.001 assessed by paired Student's t test for two‐group comparisons, and a two‐way ANOVA with Sidak's post‐test for group analysis for brain and retinal tissues
