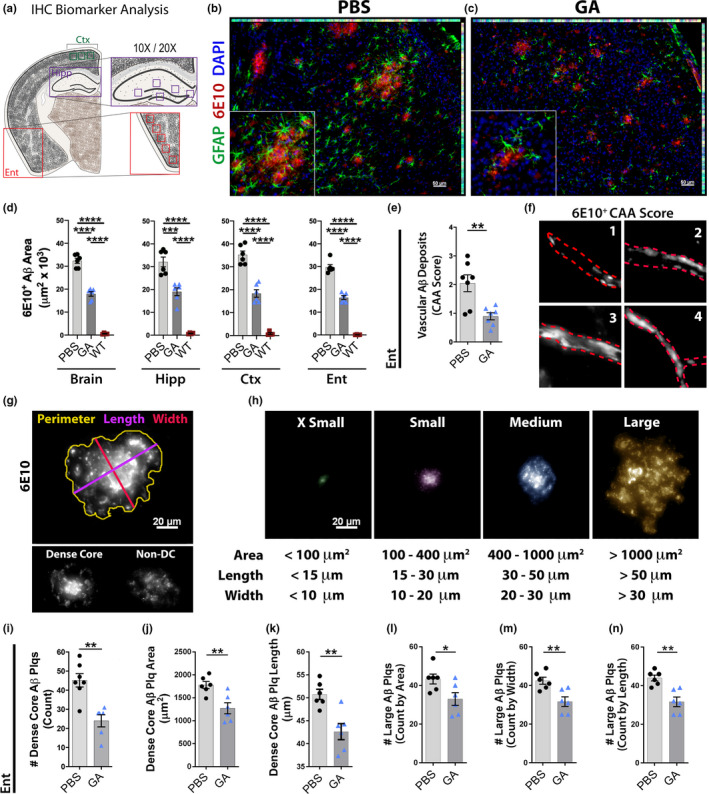
Figure 3.

Decreased cerebral Aβ ‐plaque pathology and vascular amyloidosis in old ADtg mice following GA immunotherapy. (a) Cerebral map indicating specific brain regions analyzed by IHC; regions include the cingulate cortex/retrosplenial area (Ctx), hippocampus (Hipp), and entorhinal cortex/piriform area (Ent). (b–c) Representative coronal sections of a cortical region stained for astrocytes (GFAP, green), Aβ plaques (6E10, red), and cell nuclei (DAPI; blue) in (b) PBS‐control and (c) GA‐treated ADtg mice. (d) Quantitative IHC analysis of 6E10+ Aβ‐plaque area in total brain, Hipp, Ctx, and Ent of all experimental groups (n = 6 mice per group). (e) Analysis of cerebral amyloid angiopathy (CAA) scores in the Ent of GA‐immunized versus untreated (PBS) old ADtg mice (n = 7 mice per group). (f) Representative images illustrating the scoring method used to assess vascular 6E10+ Aβ deposits [termed as cerebral amyloid angiopathy (CAA) scores], with scale ranges from 0 to 4, with higher scores for greater vascular Aβ pathology. (g) Representative images and measurements of perimeter, length (largest diameter), and width (smallest diameter) acquired per Aβ plaque (top); Dense‐core and non‐dense‐core/diffuse plaque subtypes are demonstrated (bottom). (h) Microscopic images showing classification of plaque by size, as defined by area, length and width. Accordingly, plaques were categorized into four subgroups: x‐small, small, medium, and large. (i–k) Quantitative analysis of dense‐core plaque phenotype within the Ent of GA‐immunized versus PBS‐control ADtg mice, including (i) total count, (j) average area, and (k) length. (l–n) Quantitative analysis of large Aβ‐plaque count, as determined by (l) area, (m) width, and (n) length, within the Ent of GA‐immunized versus PBS‐control ADtg mice (n = 6–7 mice per group). Bar graphs indicate mean, standard error of mean (SEM), and individual data points. *p < 0.05, **p < 0.01, ***p < 0.001, ****p < 0.0001 assessed by unpaired Student's t test for two‐group comparisons, and a one‐way ANOVA with Tukey's post‐test for three or more groups
