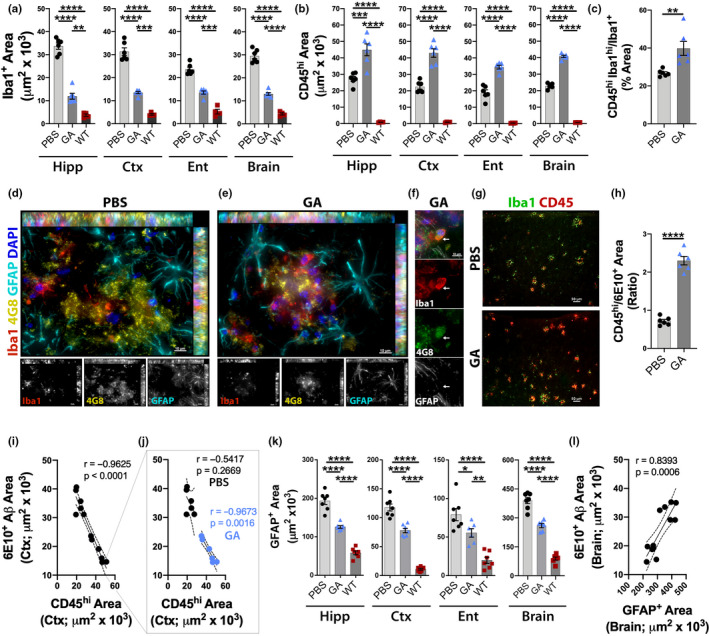
Figure 4.

Reduced cerebral microgliosis and astrogliosis along with peripheral monocyte recruitment following immunomodulation. (a) Quantitative IHC analysis of Iba1+ microgliosis within predetermined brain regions: Hipp, Ctx, and Ent, as well as their average (Brain) in GA‐immunized versus PBS‐control ADtg mice, and in naïve WT mouse littermates. (b) Quantitative IHC analysis of Iba1+CD45hi infiltrating peripheral immune cells in brain regions and their average (Brain) (n = 6 mice per group). (c) Analysis of percent area of Iba1hi/CD45hi peripheral monocytes population of Iba1+ myeloid cell area within PBS‐control and GA‐immunized groups (n = 6 mice per group). (d–e) Representative micrographs of inflammatory cells, GFAP+ astrocytes (cyan) and Iba1+ myelomonocytes (red), surrounding 4G8+ Aβ plaques (yellow) in the Ent cortex of old, late‐stage (d) PBS‐control and (e) GA‐immunized ADtg mice. (f) A representative high‐magnification micrograph of Ent cortex of GA‐immunized ADtg mice with an Iba1+ myelomonocytic cell (red) seen engulfing 4G8+ Aβ; white arrow tags location between channels. (g) Representative micrographs of Iba1+ myelomonocytes and CD45+ hematopoietic immune cells within PBS‐control and GA‐immunized mice. (h) IHC analysis of CD45hi area/6E10+ area ratio (n = 6 mice/group). (i) Pearson's r correlation analysis between CD45hi hematopoietic cells and 6E10+ Aβ‐plaque deposits in Ctx sections including PBS‐control and GA‐immunized mice (n = 12 mice). (j) Separate Pearson's r correlations between CD45hi hematopoietic cells and 6E10+ Aβ‐plaque deposits in old PBS‐control and GA‐immunized ADtg mice demonstrating retention of correlation with treatment. (k) Quantitative IHC analysis of GFAP+ astrogliosis in total brain regions for all experimental groups (n = 6–7 mice per group). (l) Pearson's r correlation analyses between GFAP+ astrogliosis and 6E10+ Aβ for total brain plaque area in PBS‐control and GA‐immunized ADtg mice (n = 12 mice). Bar graphs indicate mean, standard error of mean (SEM), and individual data points. *p < 0.05, **p < 0.01, ***p < 0.001, ****p < 0.0001 assessed by unpaired Student's t test for two‐group comparisons, and a one‐way ANOVA with Tukey's post‐test for three or more groups
