
FIGURE 2.
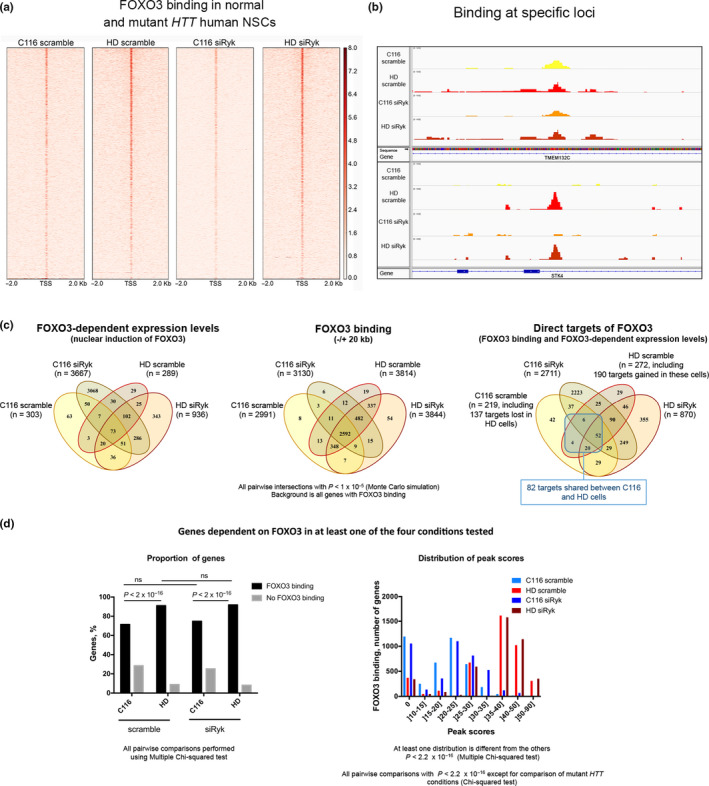
FOXO3 binding and gene regulation in human NSCs expressing normal or mutant HTT with or without Ryk silencing. (a) Enrichment of FOXO3 binding around the transcriptional start sites (TSSs) (±2 kb) in human NSCs expressing normal (C116: 19Q/21Q) or mutant HTT (HD: 72Q/21Q) and treated with Ryk siRNA‐1 (siRyk) or scrambled RNA (scramble). The color scale is chip signal intensity with maximum set as 8.0. (b) FOXO3 binding at specific loci in human C116 or HD NSCs. The upper panel is a FOXO3 binding site present in C116 and HD cells at the TMEM132C locus. The lower panel is a FOXO3 binding site gained in HD cells at the STK4 locus. (c) Venn diagrams depicting F3 gene regulation across the 4 conditions tested. The left panel shows FOXO3‐dependent genes (RNA‐seq data). The middle panel shows FOXO3 binding (ChIP‐seq data). The right panel shows the distribution of F3Ts, highlighting an increase in the number of F3Ts upon Ryk silencing in C116 (p < 2.2e‐16) and HD (p < 2.2e‐16) cells. (d) FOXO3 binding for the FOXO3‐dependent genes. The left panel shows the percentages of genes with binding or no binding. Multiple chi‐square tests were performed using the R function pairwise.prop.test. The right panel shows the signal (peak score) distributions. Chi‐squared test was performed for global and pairwise comparisons of the distributions with the R function chisq.test