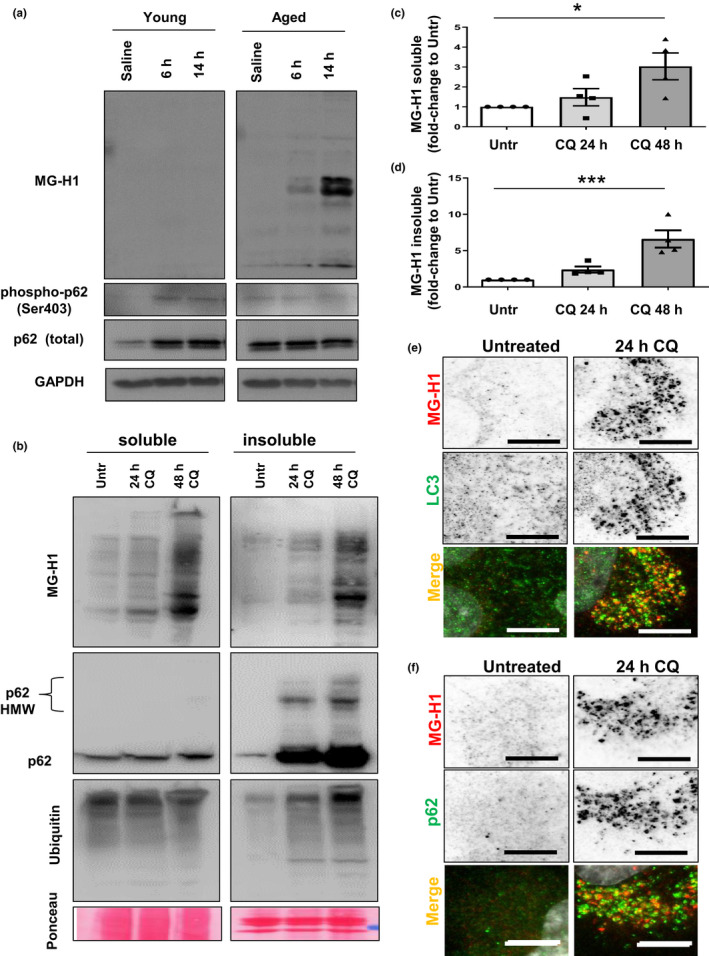
Figure 1.

Suppression of lysosomal degradation leads to accumulation of endogenous AGEs in autophagosomes. (a) Representative Western blots for MG‐H1 in young (3‐4 months old) and aged (24‐26 months old) rat hippocampus after proteasome inhibition. Note the increased amount of MG‐H1 in the aged group at 6 h and 14 h after lactacystin‐injection. p62 and phospho‐p62 are shown as autophagic markers and GAPDH as loading control. (b) ARPE‐19 maintained in the presence or absence of CQ for either 24 or 48 h were subjected to extraction with 1% Triton X‐100. Soluble (left) and insoluble (right) fractions were immunoblotted for the indicated proteins. (C,D) Quantification of total soluble (c) and insoluble (d) MG‐H1 relative to values in untreated cells. Values are mean ±SEM (n = 4). *p < 0.05 and ***p < 0.001 in one‐way ANOVA followed by Dunnett's multiple comparison test. (e,f) Accumulation of MG‐H1 in autophagosomes. HLECs were maintained in the presence or absence of CQ for 24 h, fixed in cold methanol. (e) anti‐LC3 (green) or (f) anti‐p62 (green) was used to stain autophagosomes along with anti MG‐H1 (red) to detect endogenous AGEs. Red and green channels are shown in black and white in the upper panels for a better visualization. Full fields for panel e and f are shown in SI Appendix Figure S1c (for LC3) and S2A (for p62). Scale bar: 10 μm
