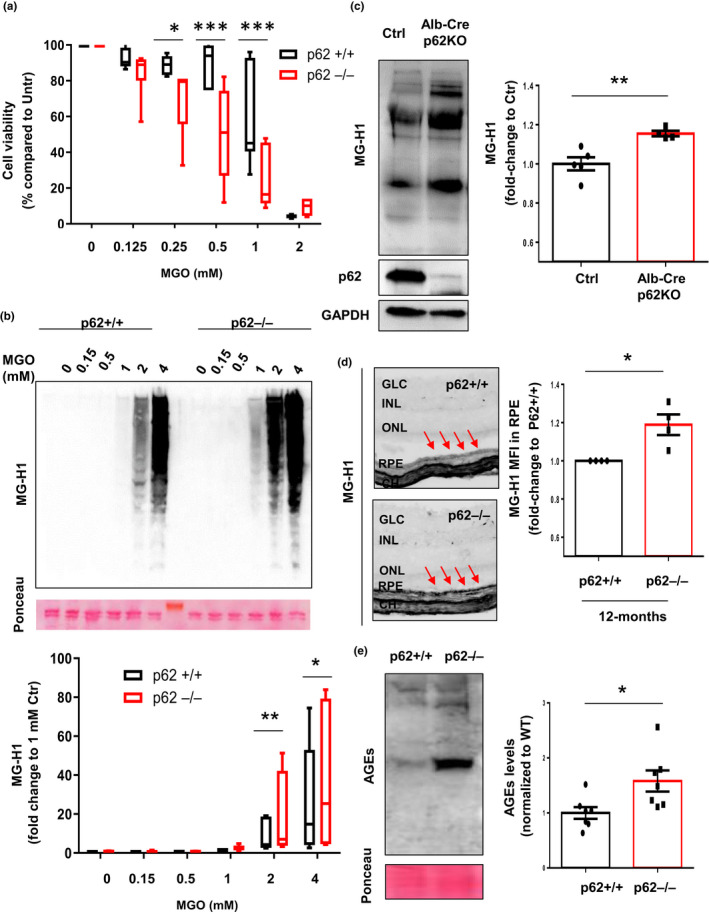
Figure 2.

Lack of p62 leads to accumulation of AGEs in vitro and in vivo. (a) Viability of p62+/+ and p62−/− MEFs treated with the indicated concentrations of MGO for 24 h was measured by Cell‐Titer assay. Values are mean ±SEM (n = 6). We observed an interaction (p < 0.0001) between the MGO concentration and the genotype using two‐way ANOVA analysis. The differences between p62+/+ and p62−/− after the Sidak's multiple comparison test were significant for the 0.25, 0.5, and 1 mM doses of MGO (*p < 0.05 and ***p < 0.001). (b) Immunoblot for MG‐H1 in whole cellular extracts from WT MEFs (p62+/+) and MEFs lacking p62 (p62−/−). Representative immunoblot (top) and quantification of total levels of MG‐H1 relative to values in treated cells with 1 mM MGO (bottom). Values are mean ±SEM (n = 10). We observed an interaction (p = 0.03) between the MGO concentration and the genotype using two‐way ANOVA analysis. The differences between p62+/+ and p62−/− after the Sidak's multiple comparison test were significant for the 2 and 4 mM doses of MGO (*p < 0.05, **p < 0.01). (c) Immunoblot for MG‐H1 in liver tissues from WT and Alb‐Cre p62−/− mice. Representative immunoblot (left) and quantification of total levels of MG‐H1 relative to values in WT (right). Values are mean ±SEM (n = 5). (d) Representative immunohistochemistry for MG‐H1 in retinal tissues from 12‐month‐old p62+/+ and p62−/− mice (left) and quantification of MFI relative to values in p62+/+ (right). Arrows indicate the retinal pigment epithelial layer. Values are mean ±SEM (n = 5). Abbreviations: CH, choroid; RPE, retinal pigment epithelium; INL, inner nuclear layer; IPL, inner plexiform layer; ONL, outer nuclear layer; GCL, ganglion cell layer. (e) Immunoblot for AGEs in WT and p62−/− C. elegans. Representative immunoblot (left) and quantification of total levels of AGEs relative to values in WT (right). Values are mean ±SEM (n = 7). *p < 0.05, **p < 0.01 and ***p < 0.001
