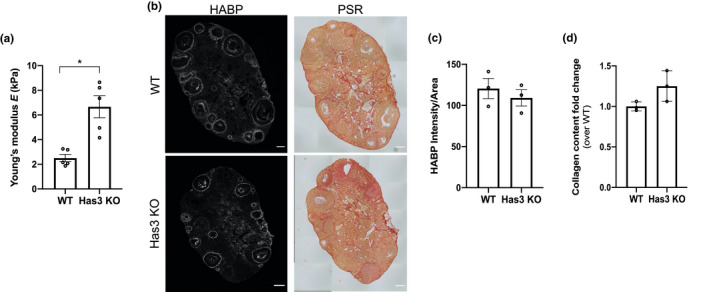
Figure 5.

HA dysregulation is associated with increased ovarian stiffness. (a) Ovarian stiffness of WT (N = 5) and Has3 KO (N = 5) mouse ovaries. (b) Representative images of WT and Has3 KO ovaries stained with HABP (HA in white) and PSR (collagen in red). Scale bar=100 μm. (c,d) HA and collagen quantification in WT (N = 3) and Has3 KO (N = 3) mouse ovaries (contralateral to the nanoindented ovaries). HA is represented as intensity per area and collagen as fold change over WT. The asterisk indicates statistical significance
