
FIGURE 3.
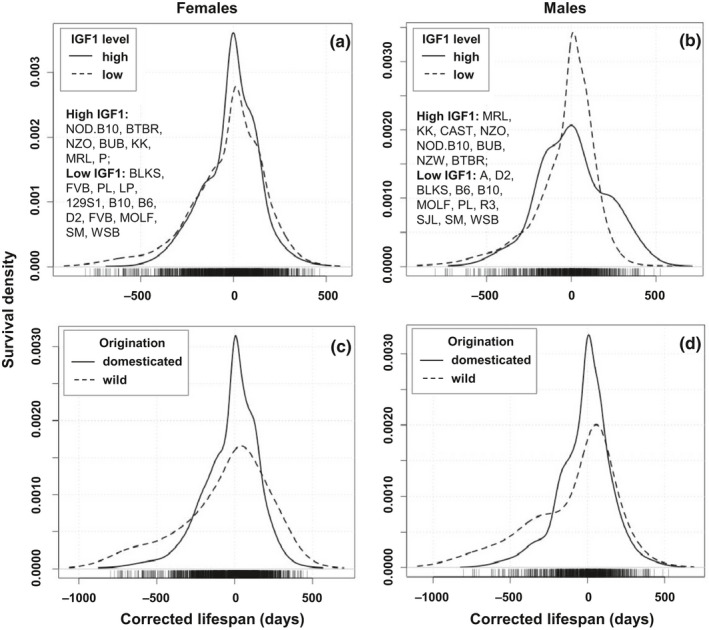
Comparison of survival density plots of strains with high and low IGF1 levels (a & b), and of the domesticated and wild‐derived inbred strains (c & d), females and male are shown separately. Strains with high and low level of IGF1 are listed in (a) and (b). Statistical comparisons of the groups are in Table 2. The X‐axes represent the corrected lifespan. The Y‐axes represent the probability that mice will survive up to the corrected lifespan. The probability density function is the kernel density estimation of R using default settings