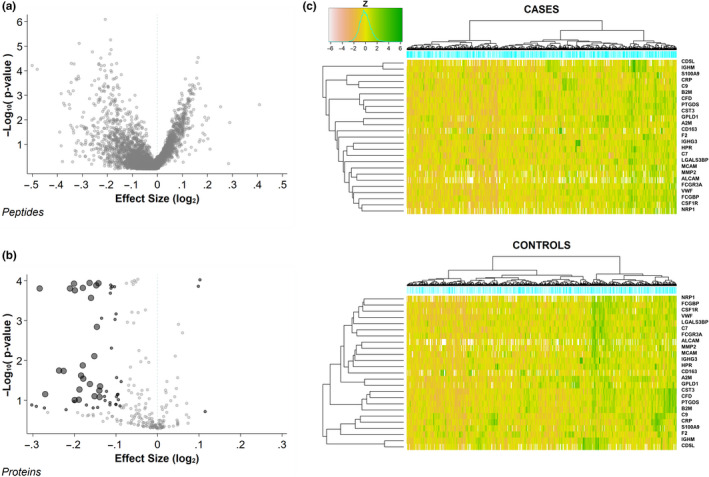
Figure 2.

Protein associations with longevity. (a)The associations of 3831 serum peptides identified by MS‐based measurements with the achievement of longevity during observation. Volcano plot of the effect sizes and negative‐log10‐transformed p‐values. (b) The associations with longevity of 224 proteins mapping to the 3831 serum peptides. Volcano plot of the effect sizes and log p‐values. Proteins associated with longevity are identified by dark symbols: large black dots =tier 1 proteins (Table 2); small black dots =tier 2 proteins (Supplemental Table 2); small gray dots =nonsignificant proteins. (c) Heatmaps showing the standardized relative abundance of the 25 tier 1 serum proteins associated with longevity in each of the 554 men who achieved longevity during observation (cases, top) and the 642 men who died before achieving longevity (controls, bottom). The z‐scores for all protein associations were precalcuated using the full cohort, so the z‐score values (represented as heatmap colors) are directly comparable between the two panels
