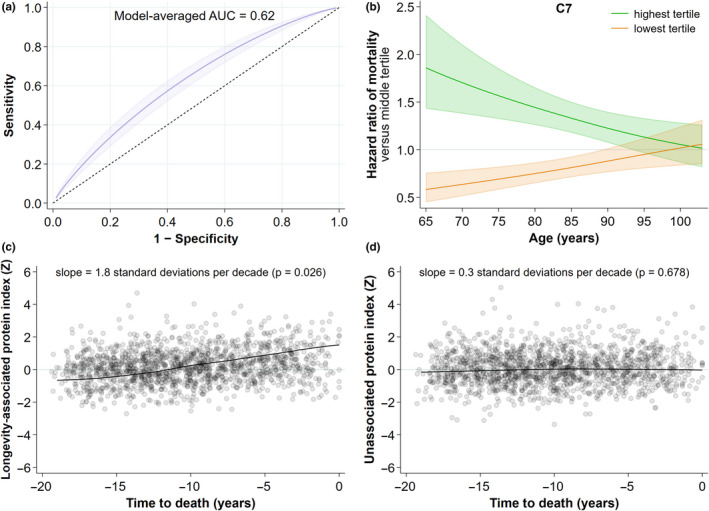
Figure 3.

Prediction of longevity and mortality. (a) Receiver operating curve analysis showing the discrimination of long‐lived vs control by a Bayesian model‐averaged classifier comprising a maximally informative subset of 14 of the 25 tier 1 longevity‐associated proteins. (b) The relationship between C7 abundance at baseline age and death rate in the entire proteomic cohort (N = 2473). Shown are the hazard ratios (HR) of death (± 95% CI) for the highest and lowest tertiles of C7 abundance compared to the middle tertile across years of age at baseline. (c) A plot of an abundance index of the 25 tier 1 longevity‐associated proteins (left) as a function of time to death, compared to an abundance index of all 165 measured proteins not associated with longevity (right)
