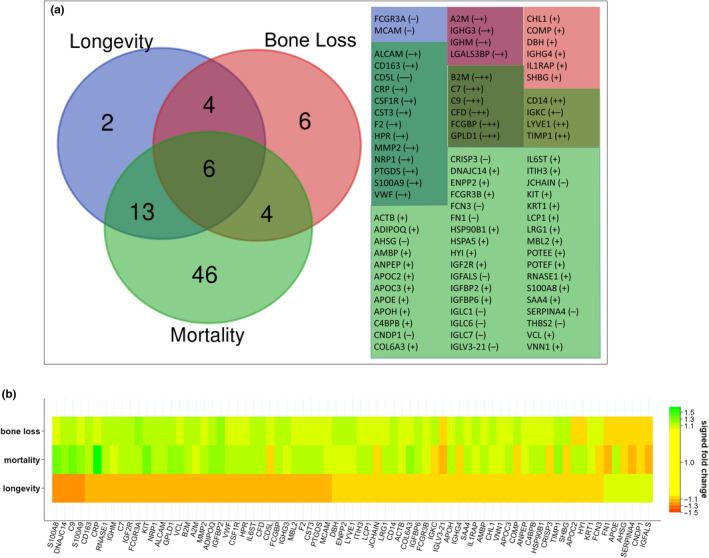
Figure 4.

Comparison of protein associations for longevity, mortality, and bone loss. (a) Venn diagram of the overlap of proteins associated with longevity, mortality, and bone loss. The accompanying table lists the overlapping proteins, with protein overlap groups color‐coded to match the regions of the Venn diagram. Shown in parentheses are the directions of protein associations for each phenotype in the order (left to right): longevity, bone loss, mortality. (b) A heatmap of the relative protein abundance of proteins associated with longevity, mortality, and/or bone loss. Shown are the signed fold changes for all proteins that were significantly associated with at least one of the phenotypes using the same criteria for significance that is used in this study (meta‐fold change at least 1.1 in magnitude and meta‐p less than 0.1)
