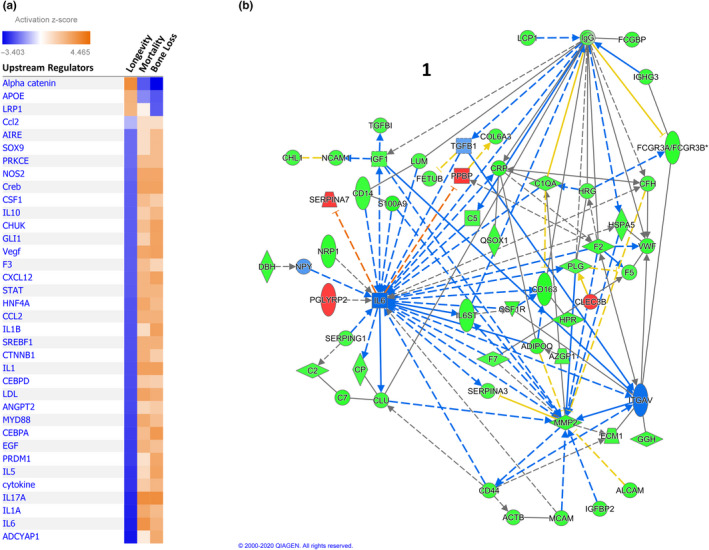
Figure 5.

Upstream regulators of proteins associated with longevity. (a) Heatmap showing upstream regulators of longevity‐associated proteins as determined by Ingenuity Pathway Analysis (IPA). Only those regulators with large activation scores (|Z| ≥2) are included. Orange shades indicate IPA‐predicted activation and blue shades indicate predicted inhibition of the regulator. (b) Network analysis (IPA) of the largest cluster (Cluster 1) of intercorrelated serum proteins associated with longevity. To derive these networks, we used IPA network‐building tools in a systematic and algorithmic manner to connect the proteins appearing in the clusters to one another and to annotate their relationships to other closely connected proteins. Green symbols show measured proteins that were decreased in long‐lived men, red symbols measured proteins that were increased, and blue symbols unmeasured proteins or regulators that are predicted by IPA to be inhibited. Blue lines represent inhibitory relationships that were consistent with IPA predictions, orange lines activating relationships consistent with IPA prediction, yellow lines relationships inconsistent with IPA prediction, black lines relationships that exist in the IPA knowledge base but without a prediction, solid lines direct relationships and dashed lines indirect relationships. Arrows indicate directionality of activation, and flat ends show directionality of inhibition. Lines with neither arrows nor flat ends indicate only a general relationship or interaction of the molecules. The names appearing in the figure are IPA gene names, not UniProt identifiers; a mapping of gene names and current UniProt identifiers is in Supplemental Table S1
