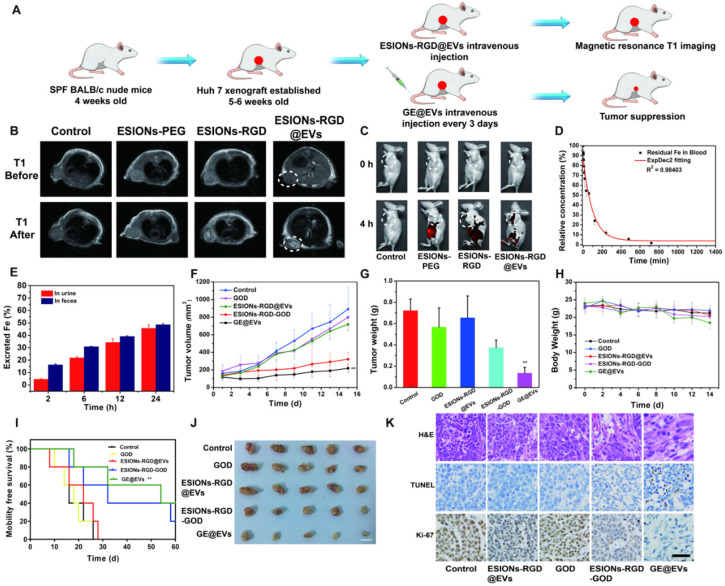
Figure 6.
In vivo pharmacokinetic analysis, diagnostic imaging and therapeutic efficacy for HCC tumor-bearing mice. (A) Schematic illustration of Huh 7 tumor xenograft establishment, GE@EVs therapeutic procedure, and MR imaging. (B) MR images of tumor-bearing mice in control, ESIONs-PEG, ESIONs-RGD and ESIONs-RGD@EVs groups under T1 (0, 2 h) mode. (C) In vivo Fluorescence imaging of mice treated with PBS, ESIONs-PEG, ESIONs-RGD and ESIONs-RGD@EVs marked by Cy 5.5. (D) Blood-circulation lifetime of GE@EVs after intravenous injection into mice (n = 3). (E) Accumulated Fe (in feces and urine) excretion out of the mice body after the injection of GE@EVs for different durations (2, 6, 12, 24, 36 and 48 h). (F) Time-dependent tumor-growth curves of nude mice (n = 5, mean ± s.d.) after different treatments, including control, free GOD, ESIONs-RGD@EVs, ESIONs-RGD-GOD, and GE@EVs. (G) Tumor weights of mice at 28 days after the treatments of each group. (H) Time-dependent body-weight curves after different treatments. (I) Survival curves of mice after various treatments as indicated in each group. (J) Digital photographs of the dissected tumors of each group (Scale bar: 1 cm). (K) H&E staining, TUNEL staining, and antigen Ki-67 immunofluorescence staining for pathological changes in tumor tissues from each group and cellular proliferation (all scale bars: 100 µm). *P < 0.05, **P < 0.01.

