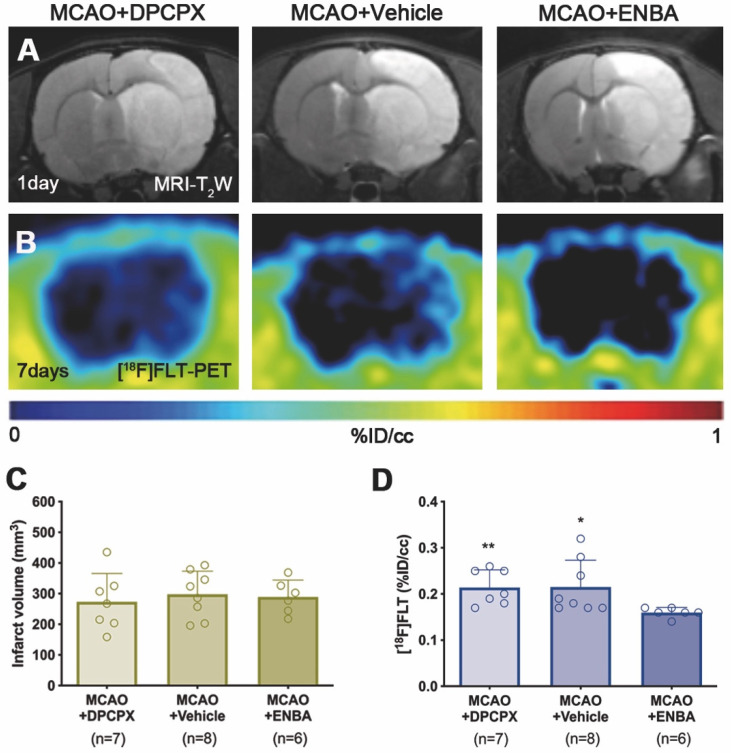
Figure 8.
MRI-T2W and PET images of [18F]FLT in DPCPX, vehicle and ENBA-treated ischemic rats. MRI (T2W) (A) and glial proliferation PET signal (B) images of axial planes at the level of the ischemic lesion. Infarct volume with MRI (T2W) (C) at day 1 and [18F]FLT PET uptake (D) at day 7 after MCAO in DPCPX (n = 7), vehicle (n = 8) and ENBA-treated (n = 6) rats. *p < 0.05, **p < 0.01 compared with MCAO+ENBA. Values are presented as scatter dot blot (mean ± SD).

